- Introduction
- 1. Introduction to Quantitative Analysis
- 2. Descriptive Statistics
- 3. T-test for Difference in Means and Hypothesis Testing
- 4. Bivariate linear regression models
- 5. Multiple linear regression models
- 6. Assumptions and Violations of Assumptions
- 7. Interactions
- 8. Panel Data, Time-Series Cross-Section Models
- 9. Binary models: Logit
- 10. Frequently Asked Questions
- 11. Optional Material
- 12. Datasets
- 13. R Resources
- 14. References
- Published with GitBook
1. Introduction to Quantitative Analysis
1.1 Seminar
Setting a Working Directory
Before you begin, make sure to set your working directory to a folder where your course related files such as R scripts and datasets are kept. We recommend that you create a PUBLG100 folder for all your work. Create this folder on N: drive if you're using a UCL computer or somewhere on your local disk if you're using a personal laptop.
Once the folder is created, use the setwd() function in R to set your working directory.
| Recommended Folder Location | R Function | |
|---|---|---|
| UCL Computers | N: Drive | setwd("N:/PUBLG100") |
| Personal Laptop (Windows) | C: Drive | setwd("C:/PUBLG100") |
| Personal Laptop (Mac) | Home Folder | setwd("~/PUBLG100") |
After you've set the working directory, verify it by calling the getwd() function.
getwd()
Now download the R script for this seminar from the "Download .R Script" button above, and save it to your PUBLG100 folder.
R Introduction
Let's get acquainted with R.
Take a look at R Studio. See the 4 windows:
- Upper-Left : R-script.
- Lower-Left : Console.
- Upper-Right : Environment (data, variables, ...)
- Lower-Right : Plots, help file, packages etc.
We begin by walking through the steps for creating and saving an R script.
- Create a new R script and save it as lab1.R to your
PUBLG100directory. - Now type the following commands in the new file you just created:
# Create a numeric and a character variable
a <- 5
typeof(a) # a is a numeric variable
[1] "double"
a
[1] 5
b <- "Yay stats class"
typeof(b) # b is a string variable
[1] "character"
b
[1] "Yay stats class"
Save your script, and re-open it to make sure your changes are still there.
# Create a vector
my.vector <- c(10,-7,99,34,0,-5) # a vector
my.vector
[1] 10 -7 99 34 0 -5
length(my.vector) # how many elements?
[1] 6
# subsetting
my.vector[1] # 1st vector element
[1] 10
my.vector[-1] # all elements but the 1st
[1] -7 99 34 0 -5
my.vector[2:4] # the 2nd to the 4th elements
[1] -7 99 34
my.vector[c(2,5)] # 2nd and 5th element
[1] -7 0
my.vector[length(my.vector)] # the last element
[1] -5
# delete variable 'a' from workspace
rm(a)
# delete everything from workspace
rm(list=ls())

# create a matrix
# type help("matrix") into the console and press ENTER
# read Description, Usage and Arguments
my.matrix1 <- matrix(data = c(1,2,30,40,500,600), nrow = 3, ncol = 2, byrow = TRUE,
                     dimnames = NULL)
my.matrix2 <- matrix(data = c(1,2,30,40,500,600), nrow = 2, ncol = 3, byrow = FALSE)
# How are the matrices different?
my.matrix1
     [,1] [,2]
[1,]    1    2
[2,]   30   40
[3,]  500  600
my.matrix2
     [,1] [,2] [,3]
[1,]    1   30  500
[2,]    2   40  600
# subsetting a matrix
my.matrix1[1,2] # element in row 1 and column 2
[1] 2
my.matrix1[2,1] # element in row 2 and column 1
[1] 30
my.matrix1[,1] # 1st column only
[1] 1 30 500
my.matrix1[1:2,] # rows 1 to 2
     [,1] [,2]
[1,]    1    2
[2,]   30   40
my.matrix1[c(1,3),] # rows 1 and 3
     [,1] [,2]
[1,]    1    2
[2,]  500  600
## ------------------------------------------------------------------------
# let's look at countries after WW2
# were western countries more democratic than the rest?
# (we proxy the "West" by NATO members)

# load the Polity IV dataset
my.data <- read.csv("http://uclspp.github.io/PUBLG100/data/polity.csv")

# View(my.data) # opens a window with the data set
dim(my.data) # returns number of rows and columns
[1] 16894 7
my.data[1:10,] # look at the top 10 rows of the data set
   id scode                          country year polity2 democ nato
1   1   AFG Afghanistan                      1800      -6     1    0
2   2   AFG Afghanistan                      1801      -6     1    0
3   3   AFG Afghanistan                      1802      -6     1    0
4   4   AFG Afghanistan                      1803      -6     1    0
5   5   AFG Afghanistan                      1804      -6     1    0
6   6   AFG Afghanistan                      1805      -6     1    0
7   7   AFG Afghanistan                      1806      -6     1    0
8   8   AFG Afghanistan                      1807      -6     1    0
9   9   AFG Afghanistan                      1808      -6     1    0
10 10   AFG Afghanistan                      1809      -6     1    0
names(my.data) # the variable names in the data set
[1] "id" "scode" "country" "year" "polity2" "democ" "nato"
# we saw the variable name country but we only saw Afghanistan in the
# first 10 rows. Are there other countries in the data set?
levels(my.data$country) # levels displays levels of a factor variable
  [1] "Afghanistan                     " "Albania                         "
  [3] "Algeria                         " "Angola                          "
  [5] "Argentina                       " "Armenia                         "
  [7] "Australia                       " "Austria                         "
  [9] "Azerbaijan                      " "Baden                           "
 [11] "Bahrain                         " "Bangladesh                      "
 [13] "Bavaria                         " "Belarus                         "
 [15] "Belgium                         " "Benin                           "
 [17] "Bhutan                          " "Bolivia                         "
 [19] "Bosnia                          " "Botswana                        "
 [21] "Brazil                          " "Bulgaria                        "
 [23] "Burkina Faso                    " "Burundi                         "
 [25] "Cambodia                        " "Cameroon                        "
 [27] "Canada                          " "Cape Verde                      "
 [29] "Central African Republic        " "Chad                            "
 [31] "Chile                           " "China                           "
 [33] "Colombia                        " "Comoros                         "
 [35] "Congo Brazzaville               " "Congo Kinshasa                  "
 [37] "Costa Rica                      " "Croatia                         "
 [39] "Cuba                            " "Cyprus                          "
 [41] "Czech Republic                  " "Czechoslovakia                  "
 [43] "Denmark                         " "Djibouti                        "
 [45] "Dominican Republic              " "East Timor                      "
 [47] "Ecuador                         " "Egypt                           "
 [49] "El Salvador                     " "Equatorial Guinea               "
 [51] "Eritrea                         " "Estonia                         "
 [53] "Ethiopia                        " "Fiji                            "
 [55] "Finland                         " "France                          "
 [57] "Gabon                           " "Gambia                          "
 [59] "Georgia                         " "Germany                         "
 [61] "Germany East                    " "Germany West                    "
 [63] "Ghana                           " "Gran Colombia                   "
 [65] "Greece                          " "Guatemala                       "
 [67] "Guinea                          " "Guinea-Bissau                   "
 [69] "Guyana                          " "Haiti                           "
 [71] "Honduras                        " "Hungary                         "
 [73] "India                           " "Indonesia                       "
 [75] "Iran                            " "Iraq                            "
 [77] "Ireland                         " "Israel                          "
 [79] "Italy                           " "Ivory Coast                     "
 [81] "Jamaica                         " "Japan                           "
 [83] "Jordan                          " "Kazakhstan                      "
 [85] "Kenya                           " "Korea                           "
 [87] "Korea North                     " "Korea South                     "
 [89] "Kosovo                          " "Kuwait                          "
 [91] "Kyrgyzstan                      " "Laos                            "
 [93] "Latvia                          " "Lebanon                         "
 [95] "Lesotho                         " "Liberia                         "
 [97] "Libya                           " "Lithuania                       "
 [99] "Luxembourg                      " "Macedonia                       "
[101] "Madagascar                      " "Malawi                          "
[103] "Malaysia                        " "Mali                            "
[105] "Mauritania                      " "Mauritius                       "
[107] "Mexico                          " "Modena                          "
[109] "Moldova                         " "Mongolia                        "
[111] "Montenegro                      " "Morocco                         "
[113] "Mozambique                      " "Myanmar (Burma)                 "
[115] "Namibia                         " "Nepal                           "
[117] "Netherlands                     " "New Zealand                     "
[119] "Nicaragua                       " "Niger                           "
[121] "Nigeria                         " "Norway                          "
[123] "Oman                            " "Orange Free State               "
[125] "Pakistan                        " "Panama                          "
[127] "Papal States                    " "Papua New Guinea                "
[129] "Paraguay                        " "Parma                           "
[131] "Peru                            " "Philippines                     "
[133] "Poland                          " "Portugal                        "
[135] "Prussia                         " "Qatar                           "
[137] "Romania                         " "Russia                          "
[139] "Rwanda                          " "Sardinia                        "
[141] "Saudi Arabia                    " "Saxony                          "
[143] "Senegal                         " "Serbia                          "
[145] "Serbia and Montenegro           " "Sierra Leone                    "
[147] "Singapore                       " "Slovak Republic                 "
[149] "Slovenia                        " "Solomon Islands                 "
[151] "Somalia                         " "South Africa                    "
[153] "South Sudan                     " "Spain                           "
[155] "Sri Lanka                       " "Sudan                           "
[157] "Sudan-North                     " "Suriname                        "
[159] "Swaziland                       " "Sweden                          "
[161] "Switzerland                     " "Syria                           "
[163] "Taiwan                          " "Tajikistan                      "
[165] "Tanzania                        " "Thailand                        "
[167] "Togo                            " "Trinidad and Tobago             "
[169] "Tunisia                         " "Turkey                          "
[171] "Turkmenistan                    " "Tuscany                         "
[173] "Two Sicilies                    " "UAE                             "
[175] "Uganda                          " "Ukraine                         "
[177] "United Kingdom                  " "United Province CA              "
[179] "United States                   " "Uruguay                         "
[181] "USSR                            " "Uzbekistan                      "
[183] "Venezuela                       " "Vietnam                         "
[185] "Vietnam North                   " "Vietnam South                   "
[187] "Wuerttemburg                    " "Yemen                           "
[189] "Yemen North                     " "Yemen South                     "
[191] "Yugoslavia                      " "Zambia                          "
[193] "Zimbabwe                        "
# we drop all oberservations which are not from 1946
my.data <- my.data[my.data$year==1946,]
my.data[1:10,]
       id scode                          country year polity2 democ nato
147   147   AFG Afghanistan                      1946     -10     0    0
248   248   ALB Albania                          1946      -9     0    0
531   531   ARG Argentina                        1946      -8   -88    0
669   669   AUL Australia                        1946      10    10    0
884   884   AUS Austria                          1946      10    10    0
1262 1262   BEL Belgium                          1946      10    10    1
1480 1480   BHU Bhutan                           1946     -10     0    0
1737 1737   BOL Bolivia                          1946      -5     1    0
2000 2000   BRA Brazil                           1946       7     7    0
2189 2189   BUL Bulgaria                         1946      -6     0    0
summary(my.data$polity2) # descriptive statistics of polity variable
    Min.  1st Qu.   Median     Mean  3rd Qu.     Max.     NA's
-10.0000  -7.0000  -1.0000   0.2319   8.0000  10.0000        3
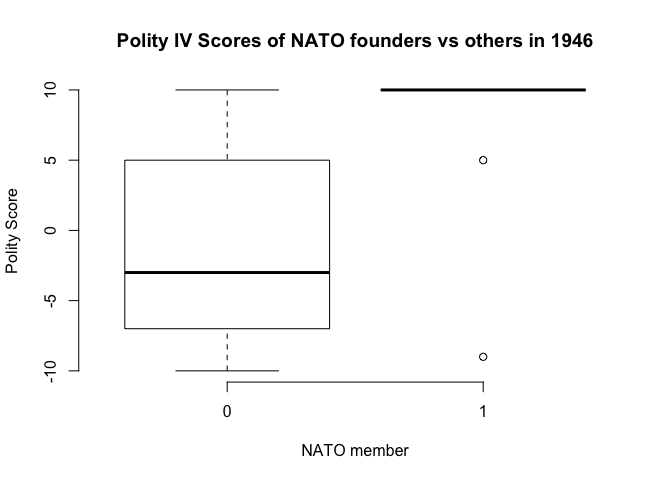
# now lets check if western countries were more democratic than the other countries in 1946
table(my.data$nato, my.data$polity2)
    -10 -9 -8 -7 -6 -5 -4 -3 -1 0 1 2 3 4 5 7 8 10
  0   4  7  3  3  4  3  2  5  3 1 1 5 1 1 3 2 2  8
  1   0  1  0  0  0  0  0  0  0 0 0 0 0 0 1 0 0  9
# descriptive summary stats of polity variable by nato membership
summary(my.data$polity2[my.data$nato==0]) # not in nato
   Min. 1st Qu.  Median    Mean 3rd Qu.    Max.    NA's
-10.000  -7.000  -3.000  -1.207   4.750  10.000       3
summary(my.data$polity2[my.data$nato==1]) # nato member
   Min. 1st Qu.  Median    Mean 3rd Qu.    Max.
 -9.000  10.000  10.000   7.818  10.000  10.000
## illustration
boxplot(my.data$polity2 ~ as.factor(my.data$nato),
        frame = FALSE,
        main = "Polity IV Scores of NATO founders vs others in 1946",
        xlab = "NATO member",
        ylab = "Polity Score")
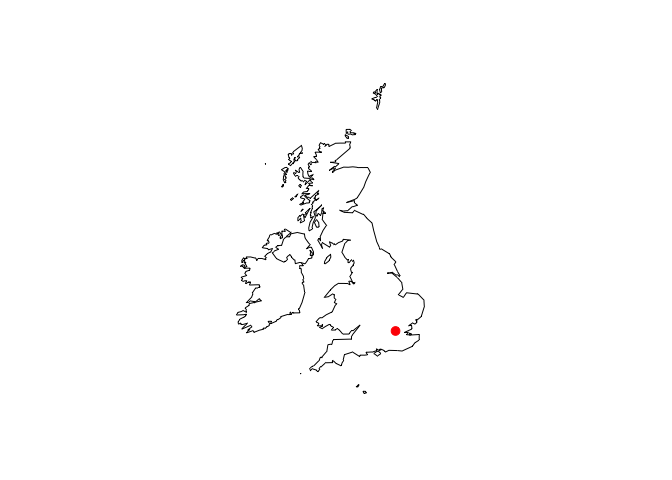
# plots you can do with R
library(maps)
 # ATTENTION: maps v3.0 has an updated 'world' map.        #
 # Many country borders and names have changed since 1990. #
 # Type '?world' or 'news(package="maps")'. See README_v3. #
library(mapdata)
map('worldHires',
    c('UK', 'Ireland', 'Isle of Man','Isle of Wight'),
    xlim=c(-11,3), ylim=c(49,60.9))
# where are we?
# let's check google maps to find latitude and longitude of SPP
# it's: 51.525051, -0.130186
points(-0.130186,51.525051,col=2,pch=20,cex=1.8) # note longitude goes first
Additional Resources
- UK general election 2015
- Interactive maps of Crime data in Greater London
- R-bloggers posts on maps
- spatial.ly - Advanced Visualizations, Analysis and Resources from James Cheshire
Exercises
- Close and then re-open RStudio.
- If your workspace is not empty, clear it.
- Check your working directory in R.
- Change your working directory to your folder N:/PUBLG100.
- Create a vector with all even elements between 1 and 11 in ascending order.
- Delete the last element from your vector.
Create a square matrix with 3 rows and 3 columns.
- Row 1: smallest positive integers divisible by 3, in ascending order.
- Row 2: smallest prime numbers, in ascending order.
- Row 3: greatest mutiples of 6, smaller than 60, in descending order.
Change the elements on the main diagonal to 1's.
- Load "polity.csv" and call your data frame "df".
- Pick the year 1991 and drop all observations from the data set that are not from 1991.
- Summarize the variable democ (stands for democracy) and produce a frequency table.
- Delete all observations from the data where democ < 0.
- Print a histogram of the democracy -- type help("hist").