- Introduction
- 1. Introduction to Quantitative Analysis
- 2. Descriptive Statistics
- 3. T-test for Difference in Means and Hypothesis Testing
- 4. Bivariate linear regression models
- 5. Multiple linear regression models
- 6. Assumptions and Violations of Assumptions
- 7. Interactions
- 8. Panel Data, Time-Series Cross-Section Models
- 9. Binary models: Logit
- 10. Frequently Asked Questions
- 11. Optional Material
- 12. Datasets
- 13. R Resources
- 14. References
- Published with GitBook
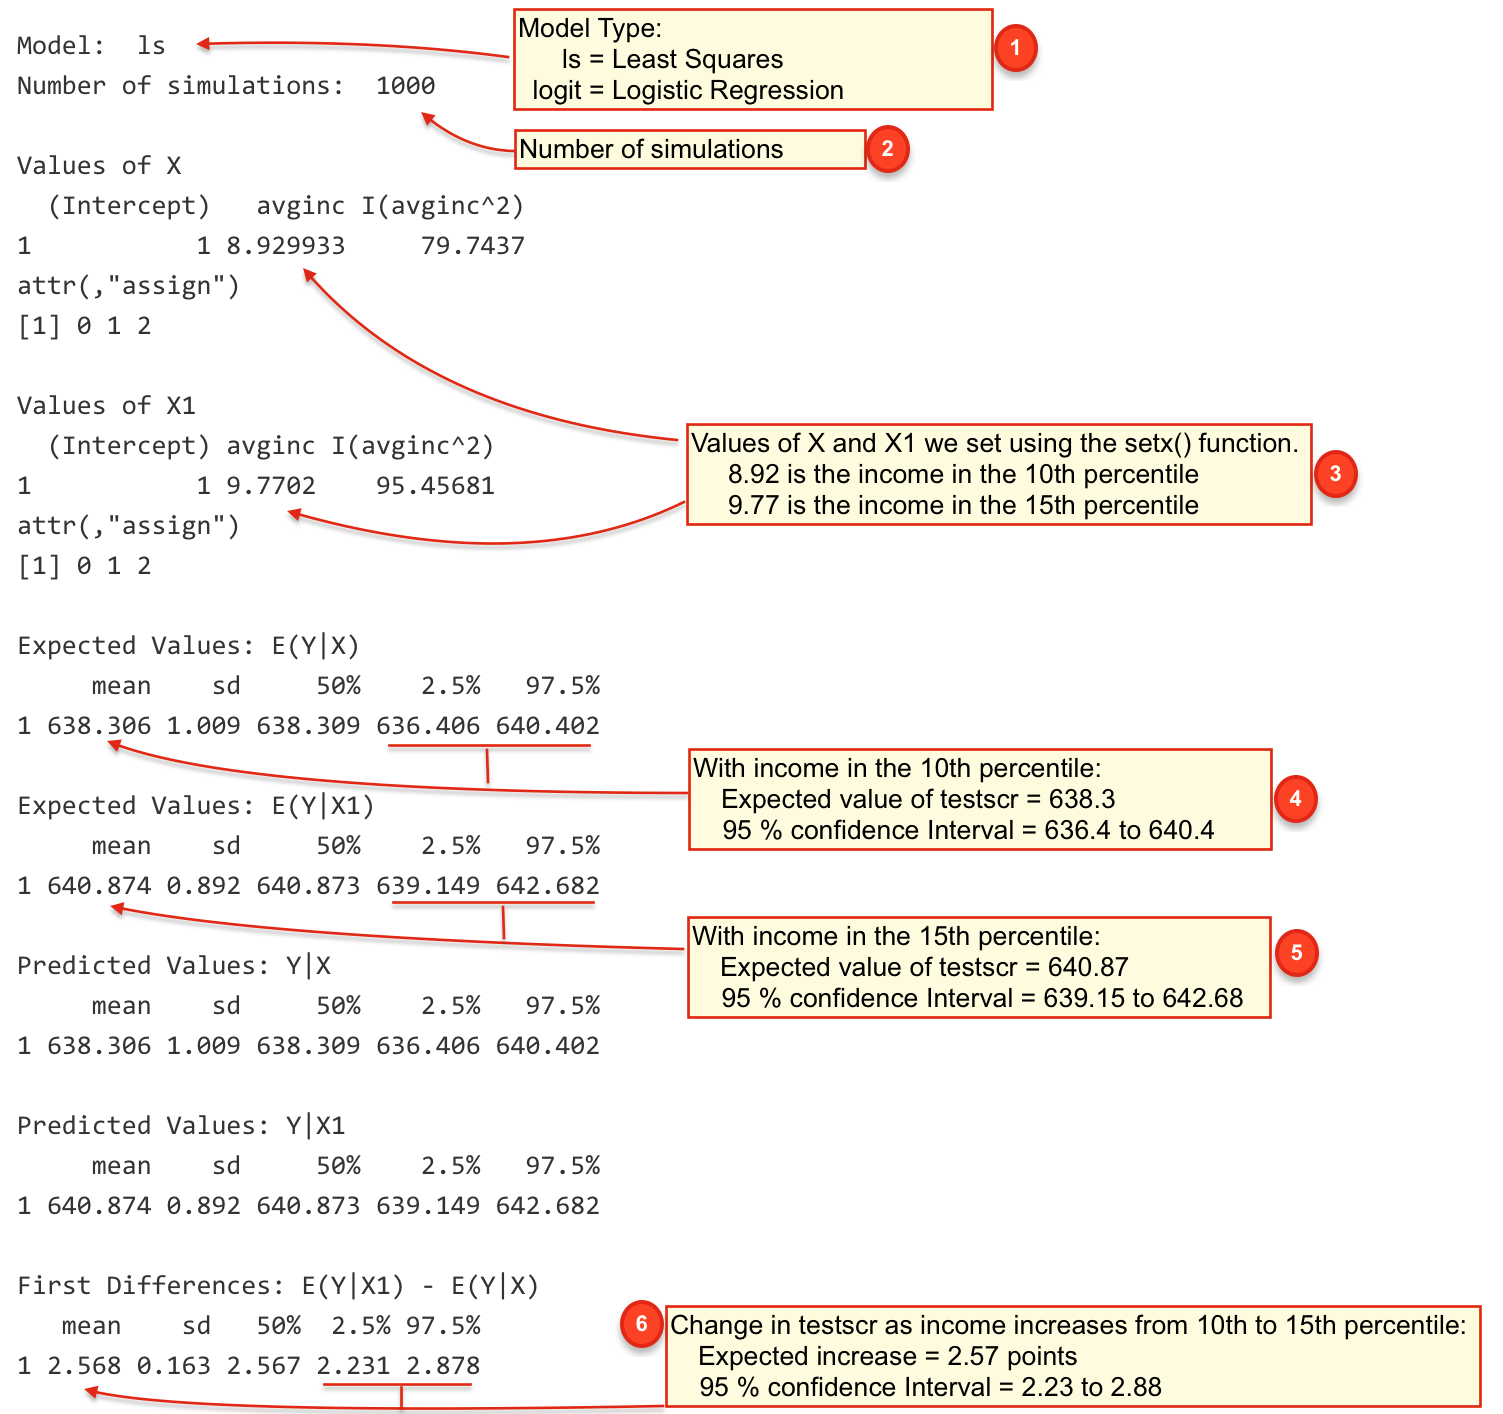
Interpreting Zelig Simulation
The example is based on the solutions for exercise 4 in seminar 7. The simulation predicts the effects of district income on test scores as the income increases from the 10th percentile to the 15th percentile.
| # | Description |
|---|---|
 |
The type of model (ls = Least Squares Regression, logit = Logistic Regression) |
 |
The number of simulations run by Zelig |
 |
The values we set for x and x1 arguments when calling the setx() function of Zelig. Since we're interested in the effect of income from the 10th percentile to the 15th percentile, we first calculate those using the quantile() function and obtain 8.92 and 9.77 respectively. |
 |
The expected values for income in 10th percentile along with the confidence interval |
 |
The expected values for income in 15th percentile along with the confidence interval |
 |
The change in test scores when income increases from the 10th percentile to the 15th percentile |