 Close
Close

Latest results from the KEOPS Campaign - 03/02/2015 - 12/02/2015
Ian McWhirter (electro-optical engineer), Anasuya Aruliah (Principal Investigator) and Amy Ronksley (finishing PhD student) travelled to the ESRANGE Rocket Range near Kiruna, Sweden to undertake maintenance and calibration of the two Fabry-Perot Interferometers. This is in preparation for a tristatic optical and radar experiment, using FPIs, EISCAT radars and the KAIRA radar around new moon on the 18th Feb 2015.

Amy and Anasuya about to clear the snow from the roof of the hut housing the FPIs. The snow was a foot deep, but light and fluffy.
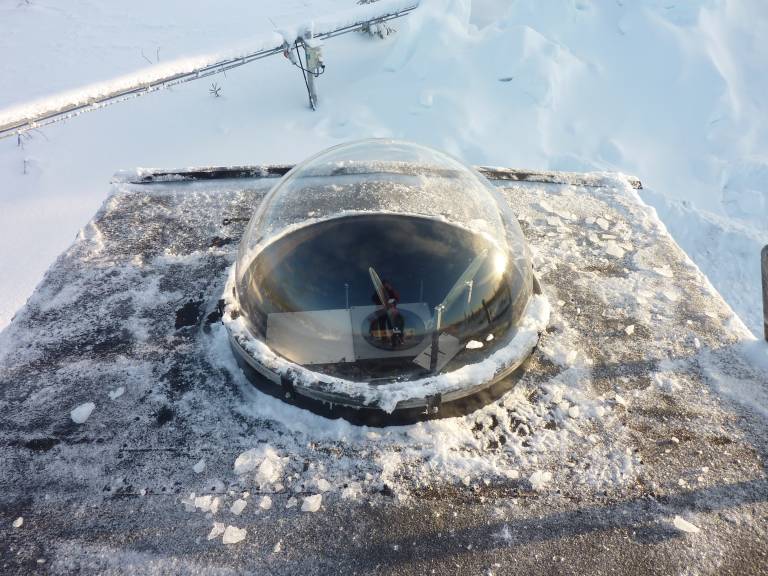
Looking at dome above the red line Fabry-Perot Interferometer (FPI), corresponding to atomic oxygen emission at 630nm
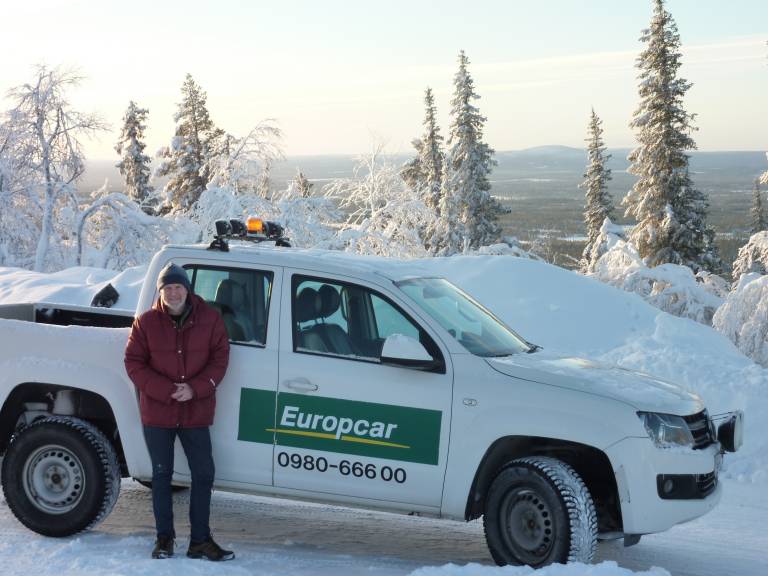
Ian standing in front of our Dukes of Hazzard hire truck - with 4-wheel drive to get us up to the top of the hill, designated a dark site for optical experiments
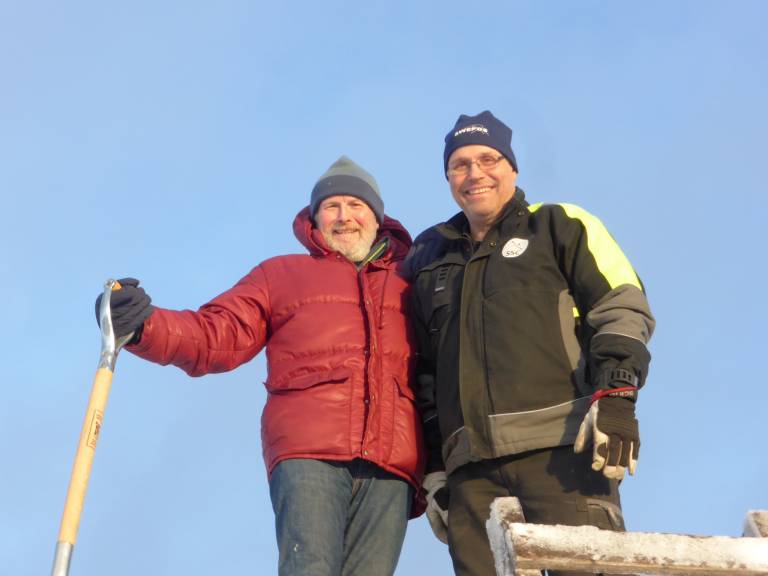
Ian with Thord Hansson, who for many years was the ESRANGE engineer who provided our on-site assistance
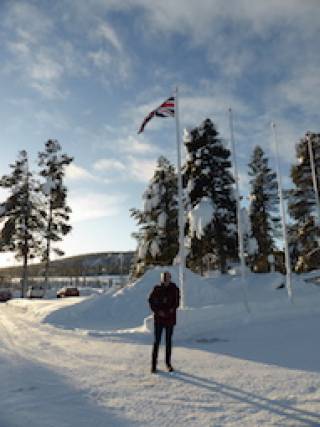
Ian standing in front of the Union Jack.
The campaign has been funded by the EOARD grant from the US Air Force.
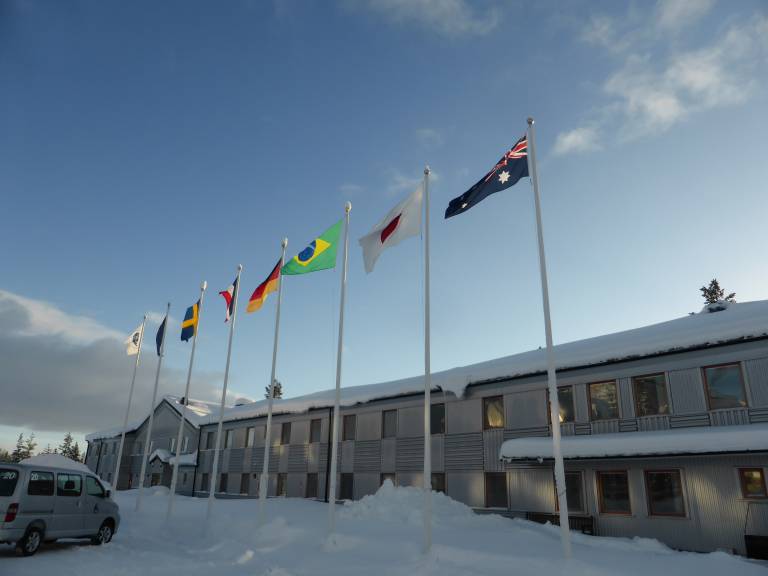
ESRANGE display the flags of all nations who are working onsite. During our visit there were preparations for the launch of a VSB-30 rocket, a micro-gravity experiment to study the behaviour of liquid hydrogen
Latest results from C-REX mission - 24/11/2014
The rocket was launched successfully from Andoya rocket range at 08:05UT 24th November 2014. Images captured from our UCL all-sky camera at 08:15UT show bright green patches where the gas has been released to the right of the image (left image), and then at 08:17UT when the gas has accelerated away along the E-field lines and faded (right image).
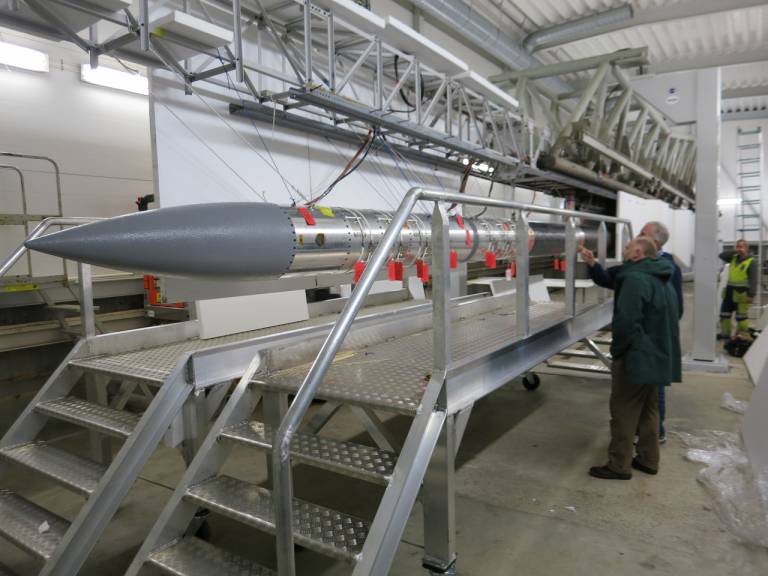
C-REX payload with 3rd and 4th rocket stages on 22nd November, before mounting to the Athena rocket launcher (Photo: M. Larsen, courtesy of Mark Conde)
 |  |
Successive images captured by the UCL all-sky camera at 08:15UT and 08:17UT. The canisters of gas released can be seen by the bright green patches to the right of the left image.
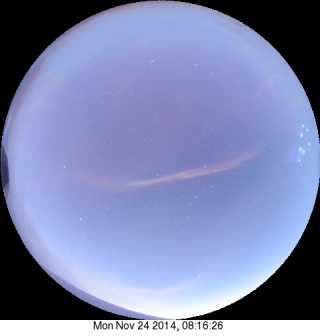
Kjell Henriksen Observatory image taken at 08:16UT. Note the bright green patches to the right of the image.
The Atmospheric Physics Laboratory
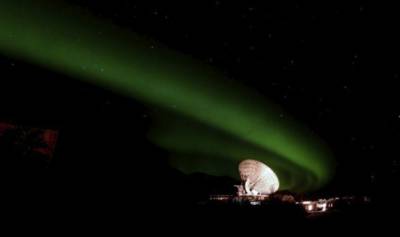
The Aurora Borealis, or Northern Lights, are a visual example of upper atmospheric phenomena.
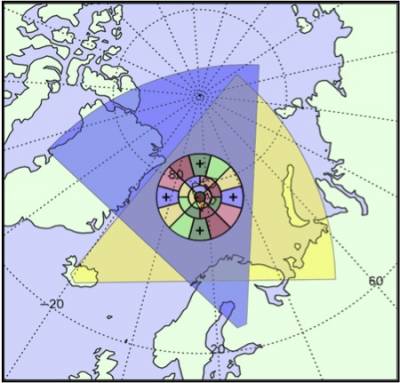 Figure 2: The concentric rings show the field of view of the UCL Svalbard SCANDI, which is overlooked by the 2 fan shapes that represent the scan of the 2 Super Dual Auroral Radar Network (SuperDARN) radars. The yellow markers show the FPIs at Kiruna and Sodankylä, also highlighted by the adjacent figure. | 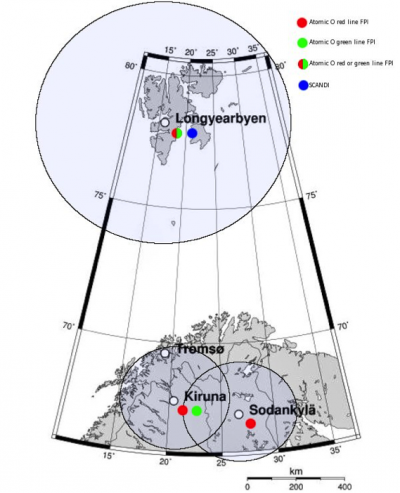 Figure 3: Map showing the location of the Kiruna and Svalbard FPIs in Scandinavia, with their respective fields of view. |
These state-of-the-art optical instruments provide continual monitoring of the upper atmosphere through the winter months of September to March. We are able to obtain high temporal and spatial resolution observations of aurora and airglow emissions, giving measurements of winds, temperatures, and gravity waves.
We are also able to study the coupling mechanisms between the dynamics of the ionosphere and thermosphere, under control of the magnetosphere.
The FPIs will be employed in a forthcoming NASA rocket experiment called C-REX, led by Dr Mark Conde at the University of Alaska, and involves scientists from the USA and UK. The all-sky Scanning Doppler Imager (SCANDI) will provide measurements of neutral winds and neutral temperatures over a region that is 1000km in diameter, while the narrow field FPI will measure the vertical wind component at a high time resolution.
The C-REX mission aims to probe the Earth’s geomagnetic cusp region and is focused on the thermosphere (altitude region 90km to 500km). In-situ observations by the CHAMP satellite have shown that the neutral mass density can increase by as much as 100% over a horizontal extent of only a few hundred kilometres. The increased density is due to the upwelling of denser air from below. This rapid changing of the thermosphere is a key area of interest due to its impact on high inclination orbits, affecting both industry and science satellites, as well as its potential to deliver a more cohesive analysis of the space environment. The mechanism/s driving this remains a mystery to the scientific community because the high viscosity of the thermosphere should result in slowly varying and spatially vast fluctuations. Several proposed explanations will be tested, including Joule or particle heating forcing neutral gas upwelling, and collisional drag from fast upwelling ions. As single mechanism models fail to reproduce satellite data, it follows that the anomaly is most likely an amalgamation of these processes. To establish this a system comprising of ground, rocket and satellite observations is needed, ultimately providing a 3-D view of the ion and neutral velocity fields. The aim is to reveal the significance of each mechanism when compared with a coupled thermosphere-ionosphere model such as APL’s CMAT2.
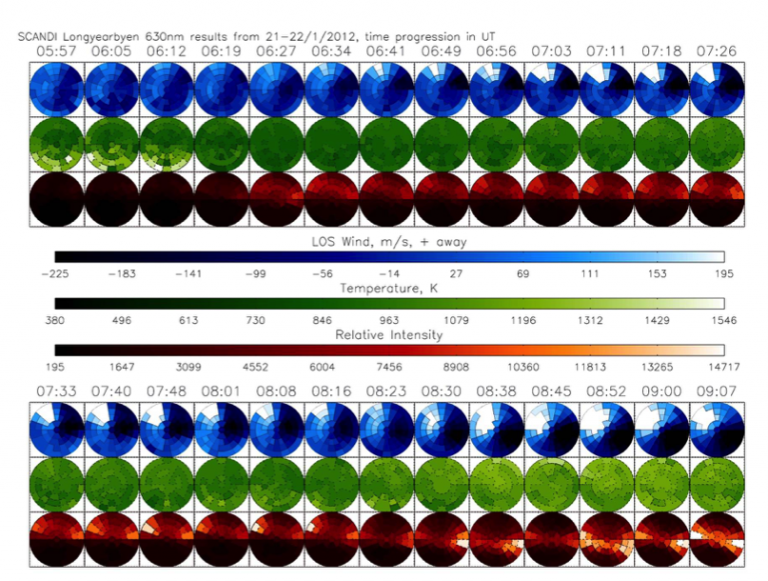
Figure 4: The Scanning Doppler Imager (SCANDI) data for the period 05:57-11:57 UT are shown in three rows. The top (blue) row shows the line-of-sight wind components seen by each of the 61 sectors. The second (green) row shows the neutral temperatures, and the third (red) row shows the 630 nm intensities at the peak emission altitude (~240km). Note the 630 nm intensity corresponds to red oxygen emission, common at heights spanning 150-250 km.
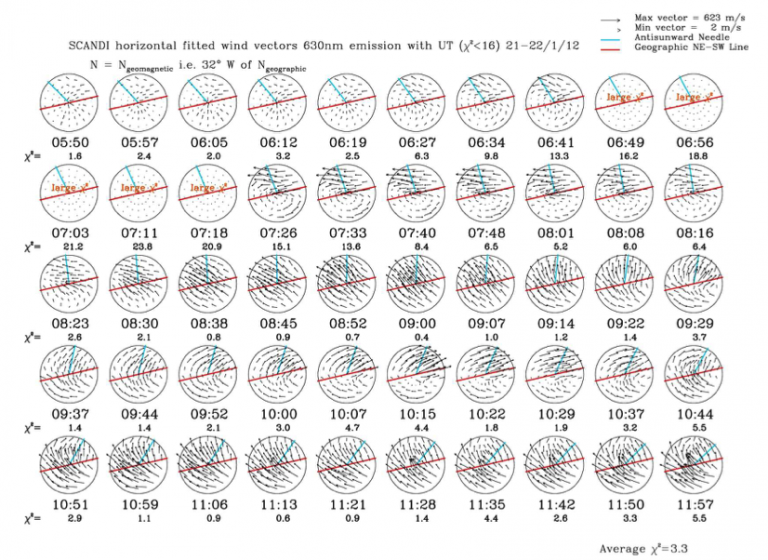
Figure 5: SCANDI wind vectors from 61 sectors over the upwelling period 05:50-11:57 UT on 22 January 2012. The red line indicates the line joining geographic NE and SW, i.e. along the look direction of the narrow field FPI. The blue indicates the anti-sunward direction indicating pressure gradient flow. Here the SCANDI winds pick up approximately 30-40 minutes after the CME. Note geomagnetic North is at the top of each circle and geomagnetic East to the right.
 |  |
Figure 6: Two images recorded by SCANDI on the 22 January 2012. Left: 06:05:15 UT, faint aurora are beginning to appear to the north. Right: 07:26:15 UT, strong aurora observed, which fills the northern half of the field of view. Note that both the red and green emissions are from forbidden electron transitions between energy levels for atomic oxygen. The intensity of the red emission over the SCANDI field of view is plotted in the red row in Figure 4.
Current developments in this field include the findings of the APL Scandinavian FPIs and the EISCAT Svalbard Radar (ESR) in a previous cusp upwelling experiment; this focused on a solar coronal mass ejection (CME) event on 22 January 2012, leading to increased geomagnetic activity (magnetic reconnection) at the Earth. Here, strong vertical winds (see Figures 4 and 5) were observed under cusp conditions connected to the rapid transport of ions. Figure 5 shows the SCANDI horizontal neutral wind vectors in geomagnetic coordinates, in which significant activity can be seen 30-40 minutes after the CME arrived. The observations indicated a strong agreement with previous CMAT2 model simulations. The hypothesis being tested is that frictional drag heating, together with soft particle precipitation (from the CME in our case study), will deposit energy at high altitudes (around 150-200km). This can result in significant upwelling because only a short column of rarefied air lies above the heating source. Consequently a dramatic increase in neutral mass density can be seen by a satellite at 400km altitude. These rapid and small spatial scale fluctuations in the thermosphere are shown in Figure 4 by the changes in temperature and line-of-sight wind components. For example, a dramatic drop in temperature of around 500K (green row) can be observed in the south of the SCANDI field of view between the images at 06:05UT and 07:26UT. Figure 5 shows the corresponding wind speeds, which start small and then grow to fast winds, but only in the northern half of the field of view. This can be interpreted by referring to the corresponding all-sky camera images in Figure 6 which highlights the appearance of strong red aurora in the northern half of the field of view.
A comparison of the EISCAT radar measurements of the ionosphere while the FPI measures the neutral thermosphere is shown in Figure 7. There is a clear correspondence between the large increase in the EISCAT ion temperature and the large upwelling observed by the FPI. The ion temperature is proportional to the size of the ion velocities. Figure 8 confirms the presence of large ion velocities by showing Super Dual Auroral Radar Network (SuperDARN) radar measurements of bursts of fast plasma flow of several hundred m/s. Both the EISCAT and SuperDARN radars independently support frictional drag acting in the altitude region of 150-200km as the likely source of heating.
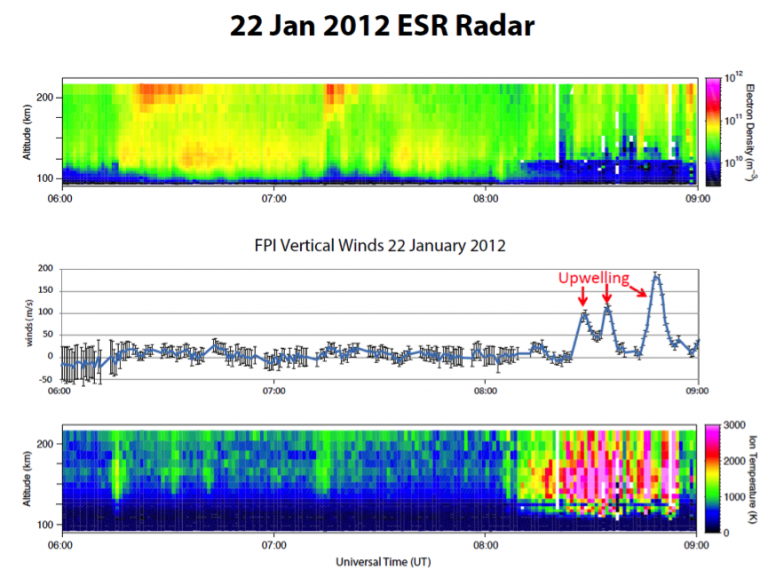
Figure 7: 22 January 2012 06:00-09:00 UT. Top panel: electron density 100-210 km; Middle panel: vertical winds from FPI; Bottom panel: ion temperature. No upwelling events are seen for either hard or soft particle precipitation events outside regions of flow-jets, but begin immediately upon the first ion frictional-drag ion-heating event (evidenced in Ti) near 200 km. These heating events recur in the data as long as the active cusp was overhead. Detailed agreement between observations and predictions were taken as strong evidence for the Carlson et al. [2012] mechanism tested here.
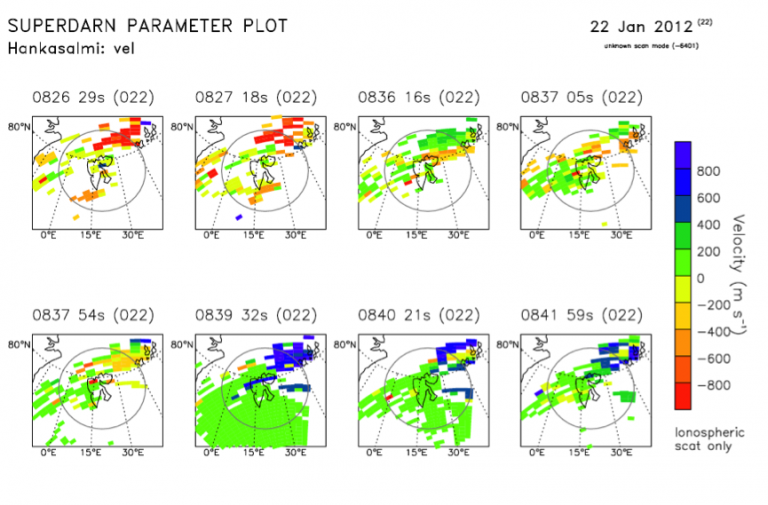
Figure 8: Examples of transient bursts of large horizontal plasma flow shown by the CUTLASS Hankasalmi radar (part of the SuperDARN radar network) between 08:26-08:42 UT on 22 January 2012 superimposed on a map centred on Svalbard. This was a period of large thermospheric upwelling. A grey circle centred on Svalbard with radius 500km defines the field of view of SCANDI.