 Close
Close

In the clinic, bestrophinopathies are diagnosed in a number of ways.
Visual acuity
Vision, i.e. how well you can see, is a baseline test which is measured routinely in clinic. It is a good guide to indicate how an eye condition is progressing. Usually, vision is measured using a letter chart, more recently a computerized letter chart may also be used. The classic letter chart is known as a Snellen chart and newer computerised charts can use a newer measurement known as LogMAR. Snellen is often the gold-standard and has one big letter at the top and the letters decrease in size and increase in number as one goes down the chart. LogMAR on the other hand has an equal number of letters on each line with logarithmic letter size progression.
Snellen Chart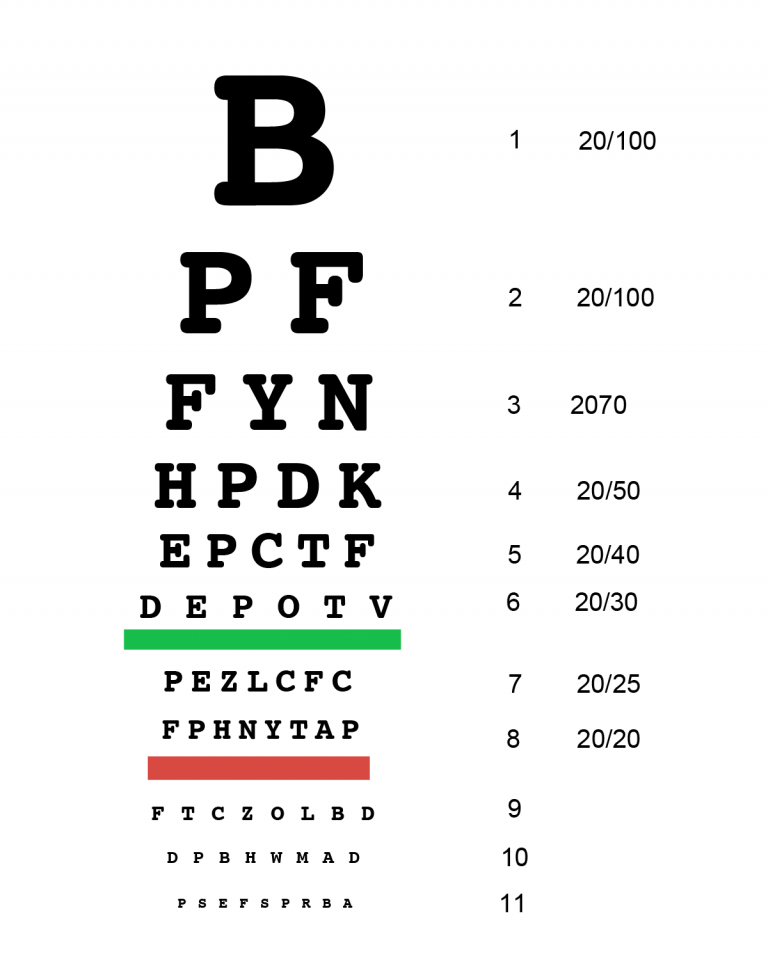 | LogMAR Chart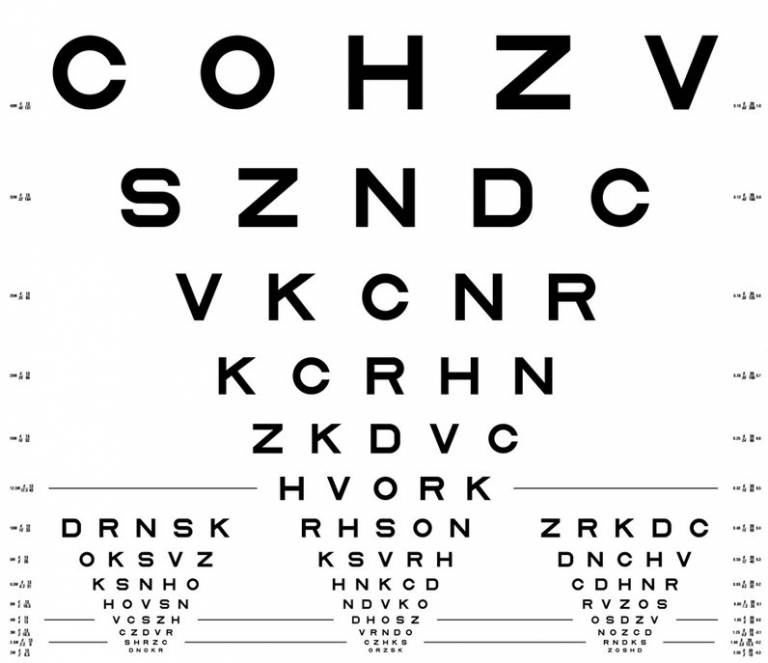 |
Normal vision is usually noted as 6/6 on a Snellen chart, this is the equivalent of 20/20 vision. A visual acuity of 6/6 is described as being able to see a letter or read a line at the distance of six meters away. Snellen charts are created and displayed in a way to mimic this (which is helpful as they no longer need to be physically 6 meters apart).
Slit lamp and Optical coherence tomography (OCT)
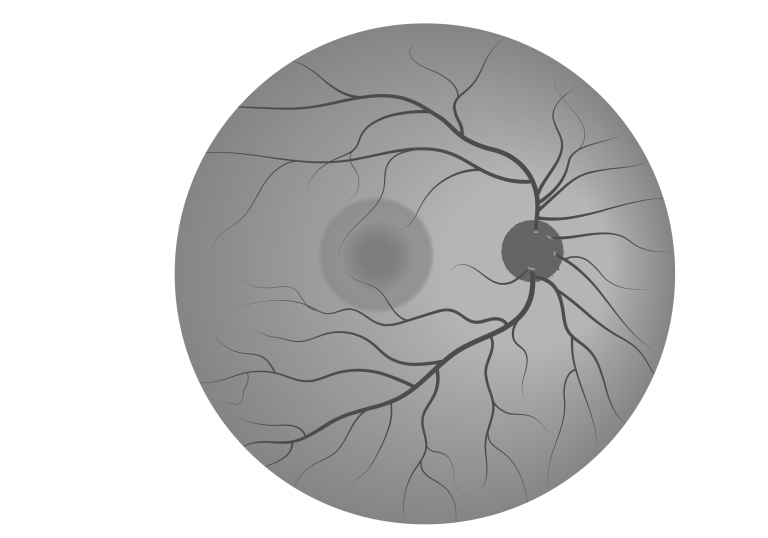
An ophthalmologist is able to look at the back of the eye (Fundus) in magnification through a slit lamp. The doctor can also use a volk lens (direct ophthalmoscopy) to examine the fundus
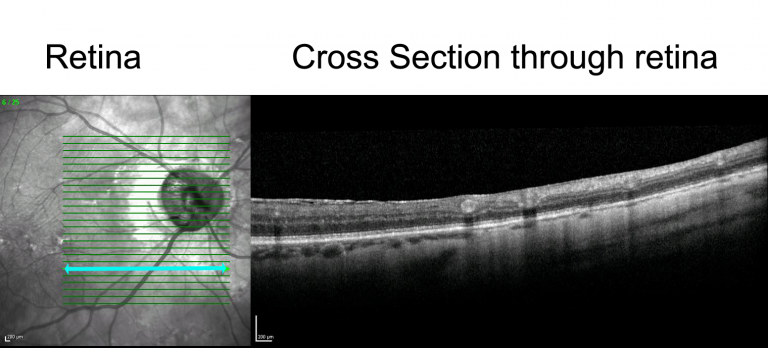
An OCT device is now a mainstay in clinics. OCT can be used to localize regions and photograph them for historic keeping, as well as being able to measure thickness of the retina. A Spectral-domain OCT (SD-OCT) uses long-wavelength light to light up the layers of the retina, creating a virtual image that a practitioner can navigate and ‘scroll’ through. This image can be processed to give a view through a slice of the retina, giving detail of the individual layers.
Volk Lens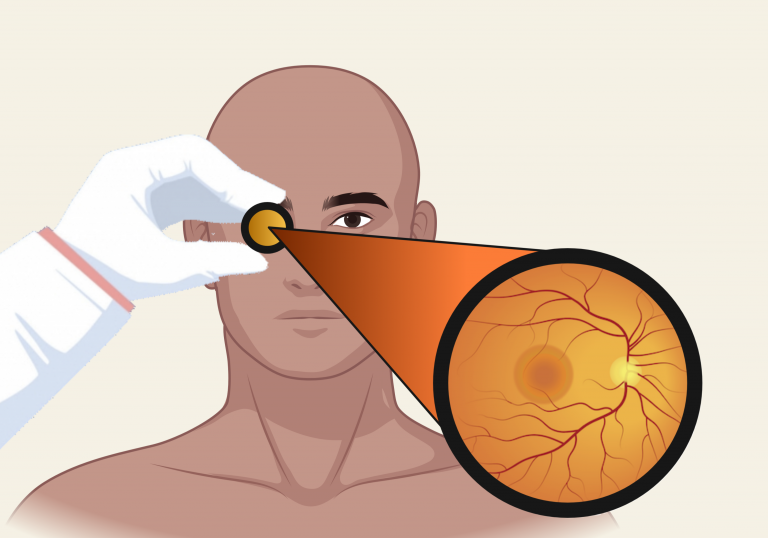 | Slit Lamp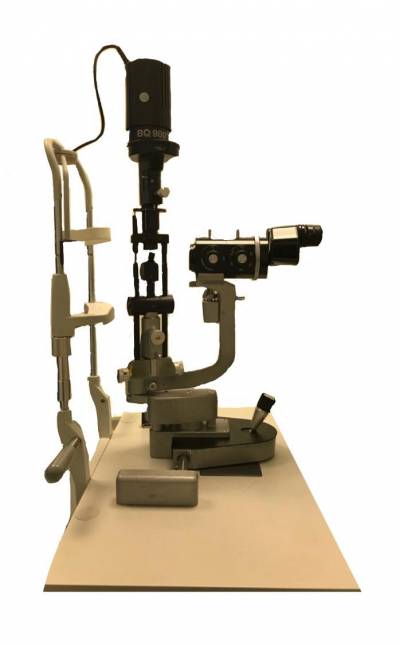 |
OCT Image
Fluorescein angiography (FA) and fundus autofluorescence (FAF)
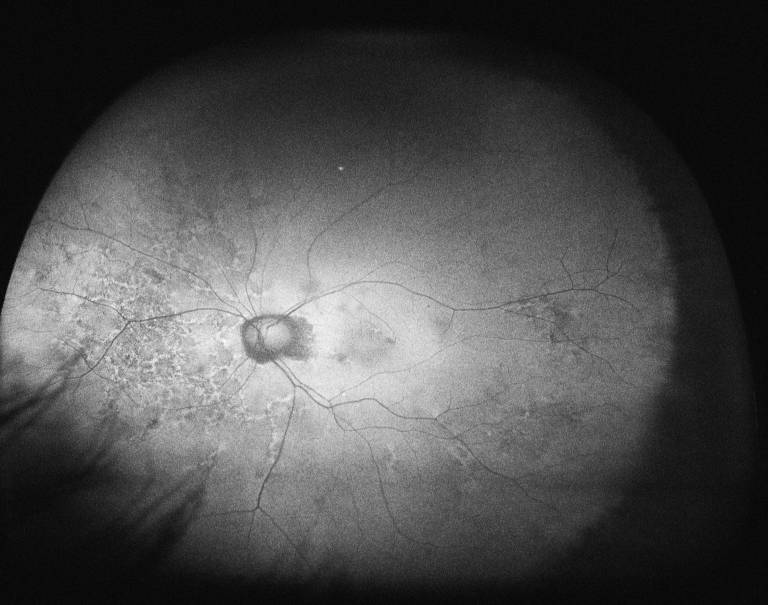
FA involves the injection of a fluorescent dye into the blood stream (usually into the arm of a patient). The dye can then be imaged as it reaches the blood vessels of the eye. FA gives information about the health of retina blood vessels, highlighting regions where there may be blockage or infiltration of new vessels and deterioration of the retina.
FAF is a non-invasive method that detects the autofluorescent (lipofuscin) material that builds up in the retina when the RPE is no longer able to process retinal waste.
 |  |
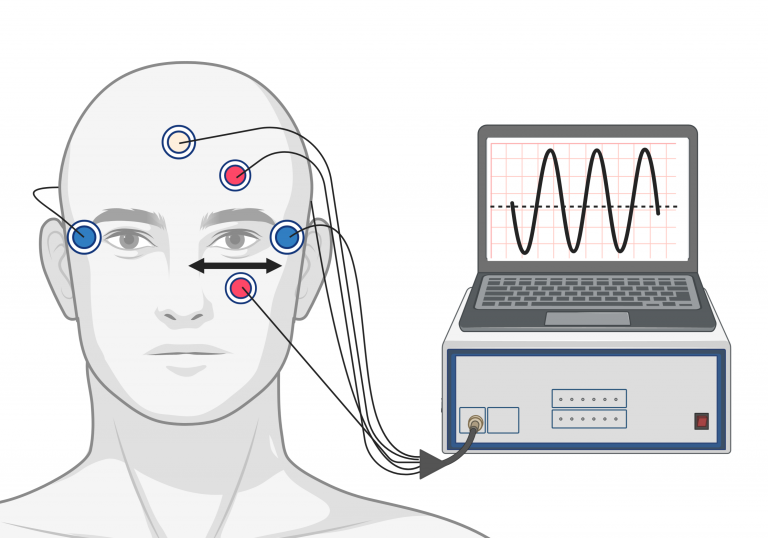
Electroretinogram (ERG) and Electrooculogram (EOG)
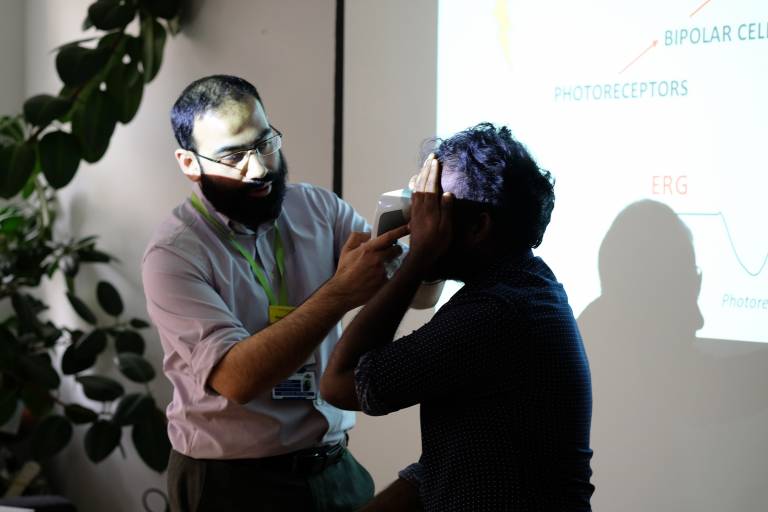
ERGs and EOGs are very important, particularly in diagnosing bestrophinopathies. Both are examples of electrophysiology tests that examine how the visual system processes information i.e. whether the cells in our retina are working correctly. ERGs measure the electrical potential which is generated from cone and rod photoreceptors. The ERG test involves dilating the eye and placing an electrode contact lens onto the front of the eye, which records the responses of the photoreceptors in response to light stimulation. Different light stimuli can be used, giving rise to different and specific recordings. ERGs can also be obtained using a hand-held device with an electrode placed under the eye.
The EOG test assesses the function of the Retinal Pigment Epithelium (RPE) by measuring the standing potential, an electrical difference between the front and the back of the eye. For the test, electrodes are attached to the skin around the eyes. The head is held in a stationary position and the patient is asked to focus on and follow a moving red light, moving their eyes side to side. EOGs are initially recorded in a dark room, the light is then switched on to continue the recording of the EOG in the light. The EOG can be an important test for diagnosing bestrophinopathies.
Visual field testing
Visual field testing can be used to see whether a patient has any missing regions of vision. The test, also known as perimetry, is automated, and works by getting the patient to focus on an object on a screen and asking them to press a button when they see a flashing light in their peripheral vision. Visual field testing allows practitioners to get a real gauge into what the patient sees and is often an important diagnostic test for certain eye conditions, such as glaucoma.
Genetic testing
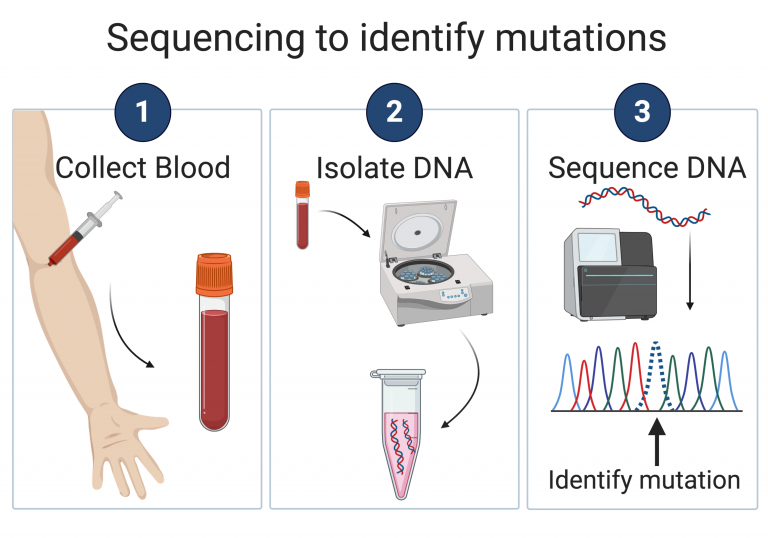
Diagnosis of a bestrophinopathy is generally confirmed using genetic testing. These tests are used to identify any changes in the DNA sequence of the BEST1 gene. To date, over 250 distinct disease-causing mutations have been recorded in the BEST1.
Once a patient is seen in clinic with a suspected bestrophinopathy, they may be asked to provide a blood sample. DNA is then extracted from the blood sample for use in sequencing. A single gene like BEST1 can be sequenced using a targeted technique called Sanger Sequencing, which looks at the order of A, T, C and Gs in the gene. Alternatively, the DNA can be submitted for gene panel testing, where a number of genes associated with eye disease are sequenced. For example, the Oculome Panel uses high-throughput sequencing of 429 genes associated with eye disorders.
A family history may also be taken to understand the inheritance pattern of the disease. A DNA change which is present throughout the family history, often leads to more confidence when diagnosing the disease. This is why the patient’s family may also be asked to provide blood samples so BEST1 and it’s inheritance pattern can be examined in detail.