Analysing the sample
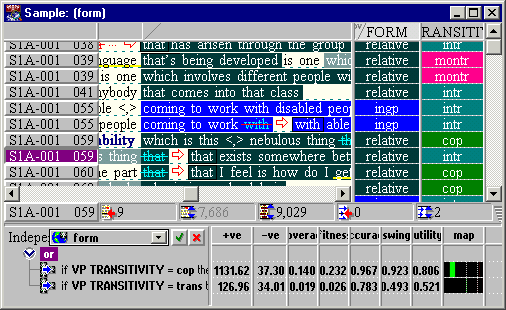
Once a sample has been constructed it can be analysed. ICECUP includes a powerful statistical ‘knowledge discovery’ tool which can explore many combinations of variables quietly in the background. The tool generates independent hypotheses about the sample which are sent to a new ‘hypothesis panel’ in the sample viewer.

Every hypothesis is tested for statistical significance. If it is significant it is then scored according to a number of factors (below). The best hypotheses are then reported.
In this example, ICECUP has found two hypotheses which show
- that the transitivity of the verb phrase has an impact on the dependent variable, and
- that, in particular, copular and ‘trans’ cases are reliable predictors for the form being relative.
The following statistics are reported. Hypotheses are rated for utility, which is calculated as a combination of four factors: coverage, fitness, accuracy and swing. Once we have a measure of which hypotheses are “better” than others, the discovery algorithm can prioritise. More complicated hypotheses are considered only if they improve on a less complex one.
|
|||||||||||||||||||||||||||||||||||||||||||||||
| What the hypothesis statistics mean | |||||||||||||||||||||||||||||||||||||||||||||||
ICECUP can help you evaluate these hypotheses in terms of the cases they cover in the corpus.
This page last modified 7 July, 2020 by Survey Web Administrator.