Performing experiments using FTFs
A table of critical values for chi-square
|
||||||||||||||||||||||||||||||||||||||||||||||||||||||||||||||||||||||||||||||||||||||||||||||||||||||||||||
How to use this table
The table lists critical values of χ² for degrees of freedom, df, from 1 to 25. It quotes critical values at two levels: with a probability of error, p = 0.05, i.e., 1:20, and p = 0.01, i.e., with an error of 1:100. Usually an error rate of 1 in 20 is quite sufficient. This means that there is a chance of one in twenty of detecting a change in the sample when there is no real change in the population. If you choose the lower threshold, you tend to make the opposite error of being over-cautious.
The number of degrees of freedom for a contingency table column is the number of cells, minus one, usually written as df = r-1 where r is the number of rows in the column. The number of degrees of freedom for an entire table or set of columns, is df = (r-1) x (c-1), where r is the number of rows, and c the number of columns.
We should remind the reader that each cell in the expected distribution must have at least 5 cases in it; if not, collapse values together, as in the two-features-in-a-clause example here (see the effect of mood on ditransitive). The number of degrees of freedom will then fall.
If your value of df is greater than 25, you will need to refer to other tables. (NB. Sometimes error levels are quoted by the probability that the test is successful, i.e., p = 0.95; 0.99, as below. If you see figures like this, just subtract them from 1.)
The mathematics of chi-square
You may be interested to know that critical values of chi-square may be calculated from first principles. This is useful if you need to calculate the critical value for fractional degrees of freedom or for different error levels.
 |
|
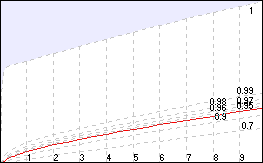
The graph plots critical threshold lines for p = 0.95 (red) through to p = 0.99 and even 1 (top line). Note that the line straightens out as df increases so you can estimate critical values for higher degrees of freedom relatively easily.
The shaded area is beyond the limit (p = 1 / probability of an error is 0). The critical value for p = 1 is finite and can be exceeded by a χ² test, especially if a large amount of data is found.
Philosophical question: would an error level of 0 mean that an experimental result was guaranteed correct? (A. No, it means that there is a limit to how measurable the reproducibility of an experiment is.)
Online resources
| » | Statistical tables from the US National Institute of Standards and Technology (NIST) handbook | |
| » | Critical value calculator courtesy of David W. Stockburger | |
| » | 2 x 2 χ² (Excel) | |
| » | Further reading: z-squared: the origin and use of χ² (PDF) |
FTF home pages by Sean Wallis
and Gerry
Nelson.
Comments/questions to s.wallis@ucl.ac.uk.
This page last modified 28 January, 2021 by Survey Web Administrator.