 Close
Close

Laser scanning snow on Antarctic sea ice
2 October 2023
Earth Sciences recently purchased a Terrestrial Laser Scanner (TLS). Dr Robbie Mallett, our PhD alumni took it with him to West Antarctica for the winter season to map the centimeter-scale roughness of snow on sea ice and produce the digital elevation models of snow patches.
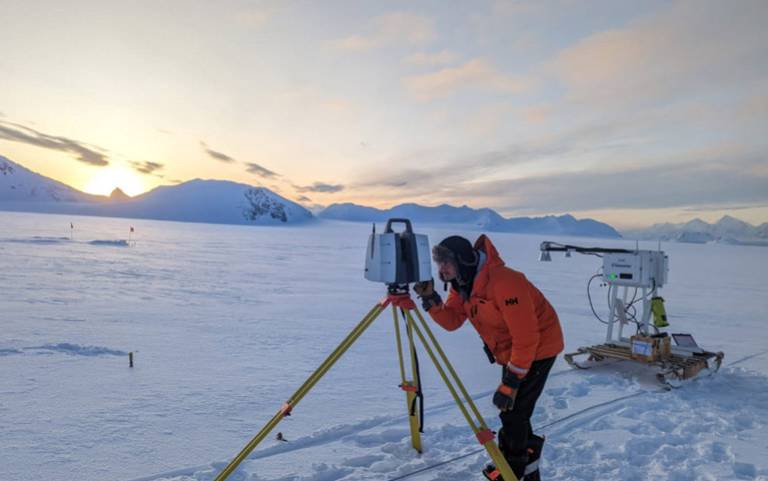
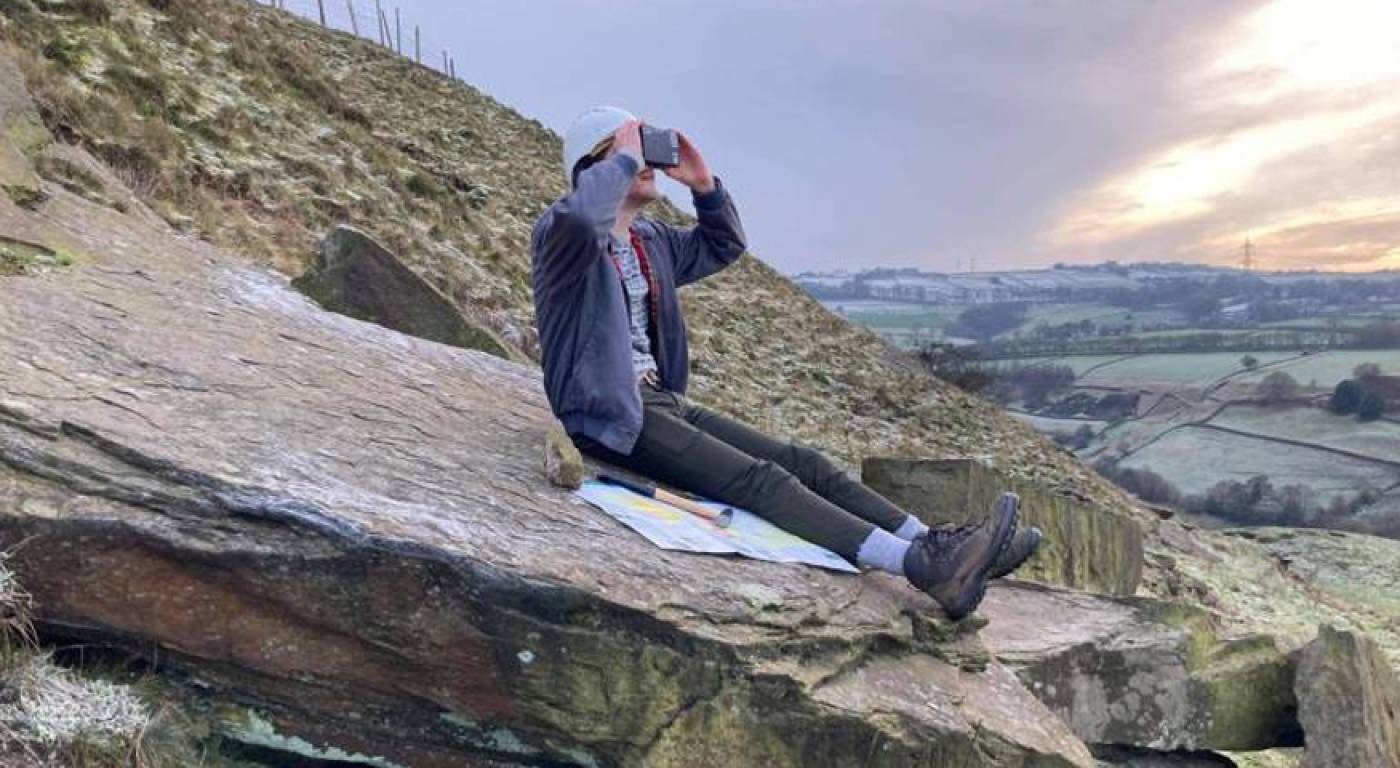
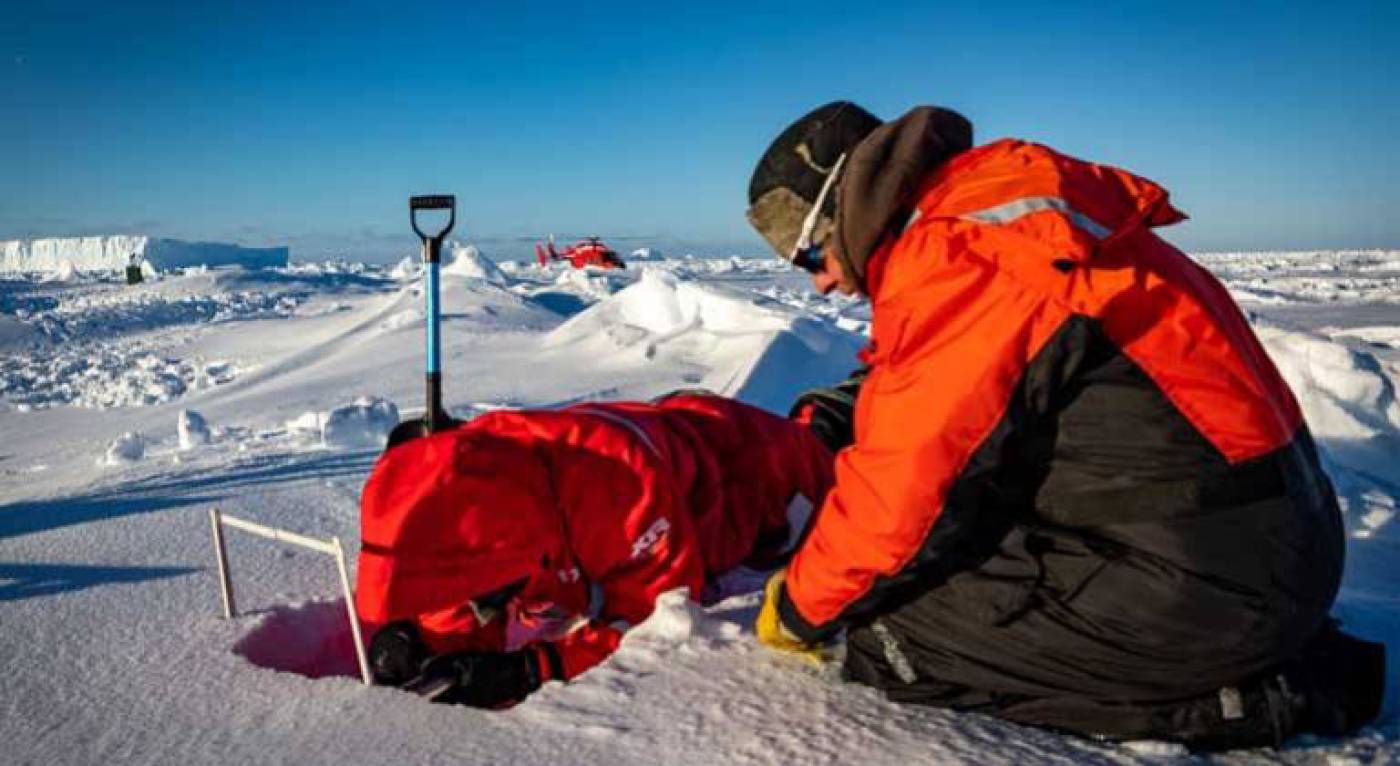
Image: Using the laser scanner on a nearby glacier, with our sled-mounted radar in the background.
Earth Sciences recently purchased a Terrestrial Laser Scanner (TLS). This is a tripod-mounted Leica P50 weighing around 30 kg all-in, which I took with me to West Antarctica for the winter season there. I was working as part of a British Antarctic Survey led project named DEFIANT, which aims to understand what has driven consistently poor and still declining sea ice conditions around the continent since 2016. UCL (via Prof Julienne Stroeve and Dr Rosemary Willatt) is providing the project with expertise in remote sensing technologies such as radars and lasers.
My colleague Vishnu Nandan and I used the instrument to map the centimetre-scale roughness of snow on sea ice, before scanning the same snow with radar instruments that simulate the functionality of satellite-mounted altimeters. The laser scanner produced digital elevation models of 1m2 snow patches with a spatial resolution of around one point per millimetre in about five minutes. Roughness on the centimetre scale is emerging as a key factor in determining whether radar waves will penetrate the snow surface, and this is the first time we’ve completed a dual radar/laser characterisation on sea ice with this resolution.
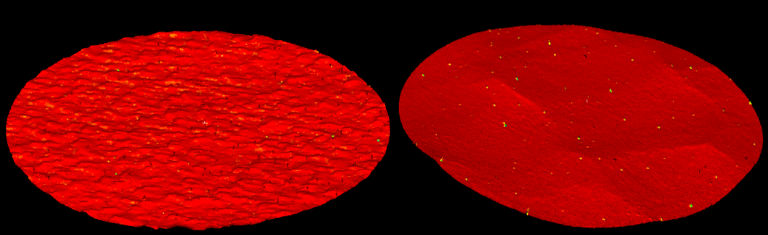
Figure: Two patches of snow (80 cm diameter) with different roughness characteristics. Snow on the left is flat on a large scale, and rough on a small scale. Snow on the right is rough on a large scall, and smooth on a small scale.
We focused our science on relatively small patches of snow; this was in part because that’s the patch size scanned by our radar in one shot, but also because the near-infrared wavelength of laser light used by the scanner does not reflect well from snow and ice surfaces (they’re very dark), so scanning icey surfaces more than 100 m away takes prohibitively long. The scanner must also be totally level for the duration of the scan, which was difficult for us as land-adjacent sea ice rises, bends and tilts with the tide, the waves and as you walk around on it. We found that the scanner worked excellently in temperatures down to -20°C, and the performance of its batteries in particular was outstanding.
“Before I flew home we picked out our favourite scientific instruments from the twenty-something that we took with us; the laser scanner came an impressive second, next only to the indomitable folding ruler.
We will now analyse the snow-patch DEMs produced by the scanner, with a focus on which statistical metrics contain the most information about the coincident radar data that we collected. Despite the historically poor sea ice conditions, our overwintering campaign was mostly a success. This was in large part due to the TLS.
Links:
- Dr Robbie Mallett personal page
- Drivers and Effects of Fluctuations in sea Ice in the ANTarctic (DEFIANT)
Exploring Earth Sciences:
YouTube Widget Placeholderhttps://www.youtube.com/watch?v=tMjHoVtMhW8&feature=emb_logo
Our Alumni stories
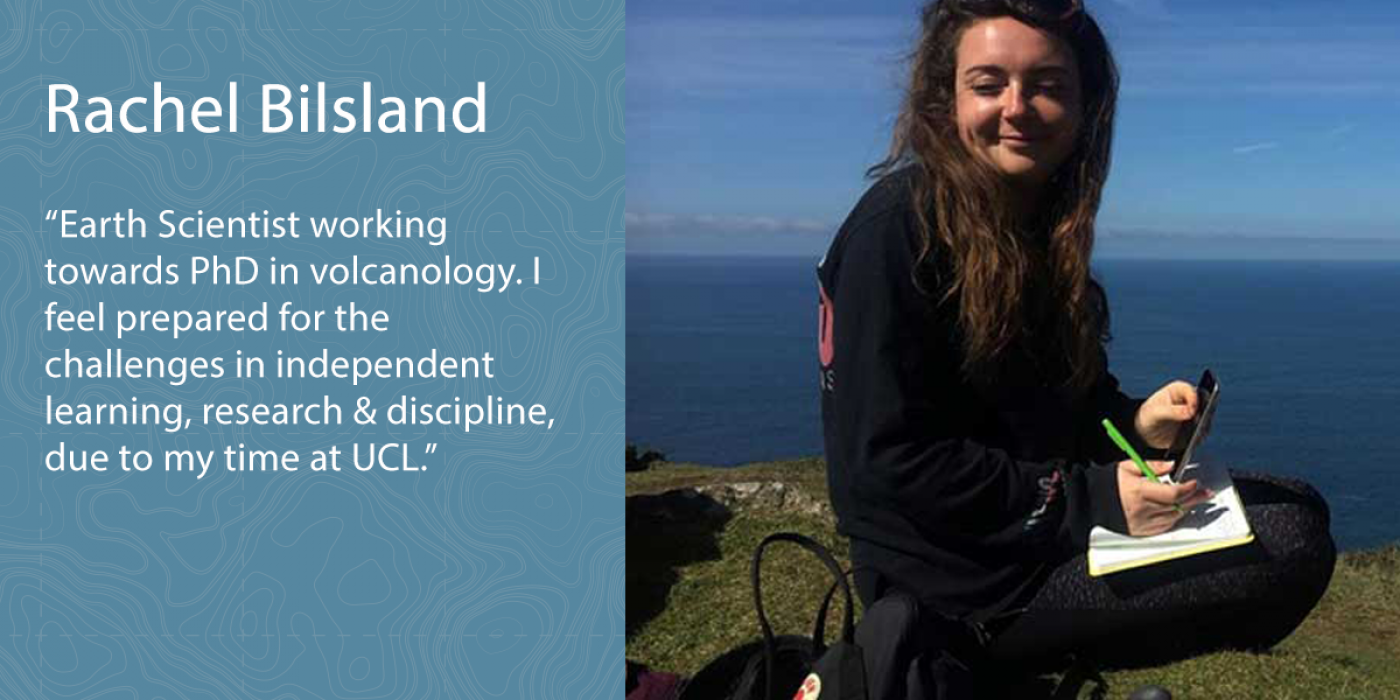
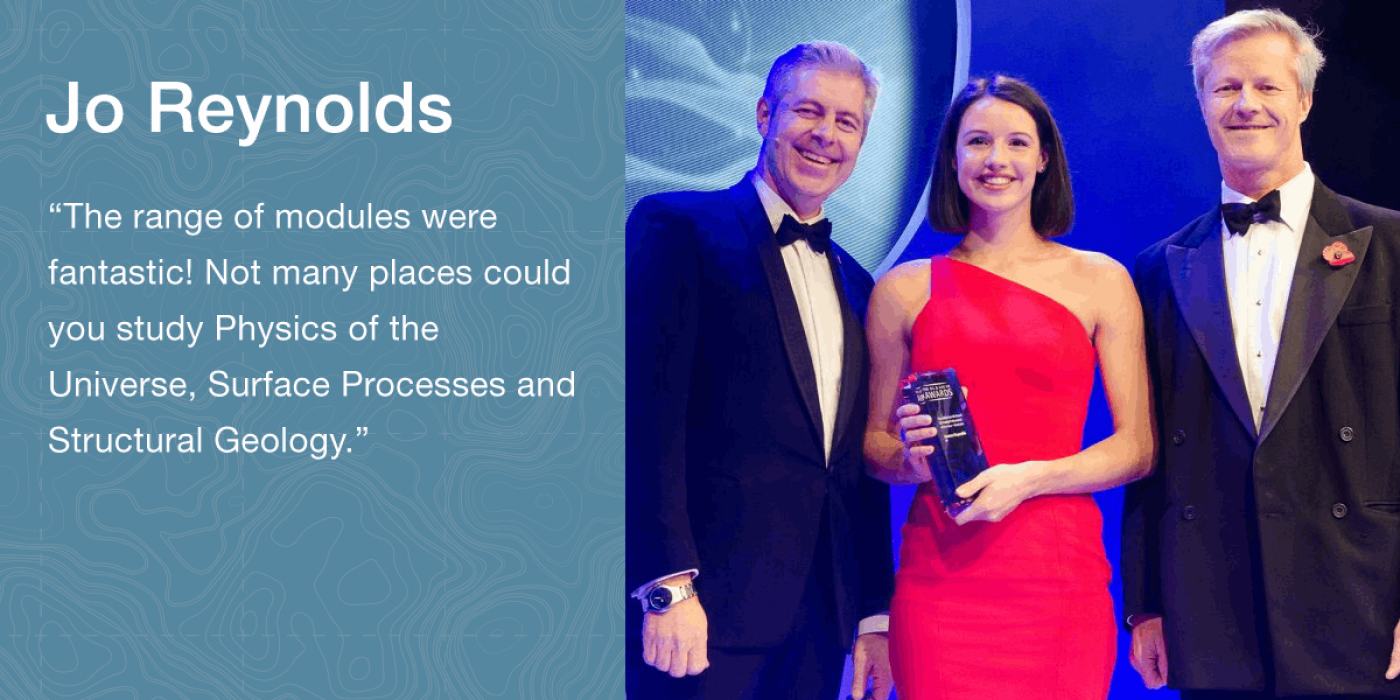
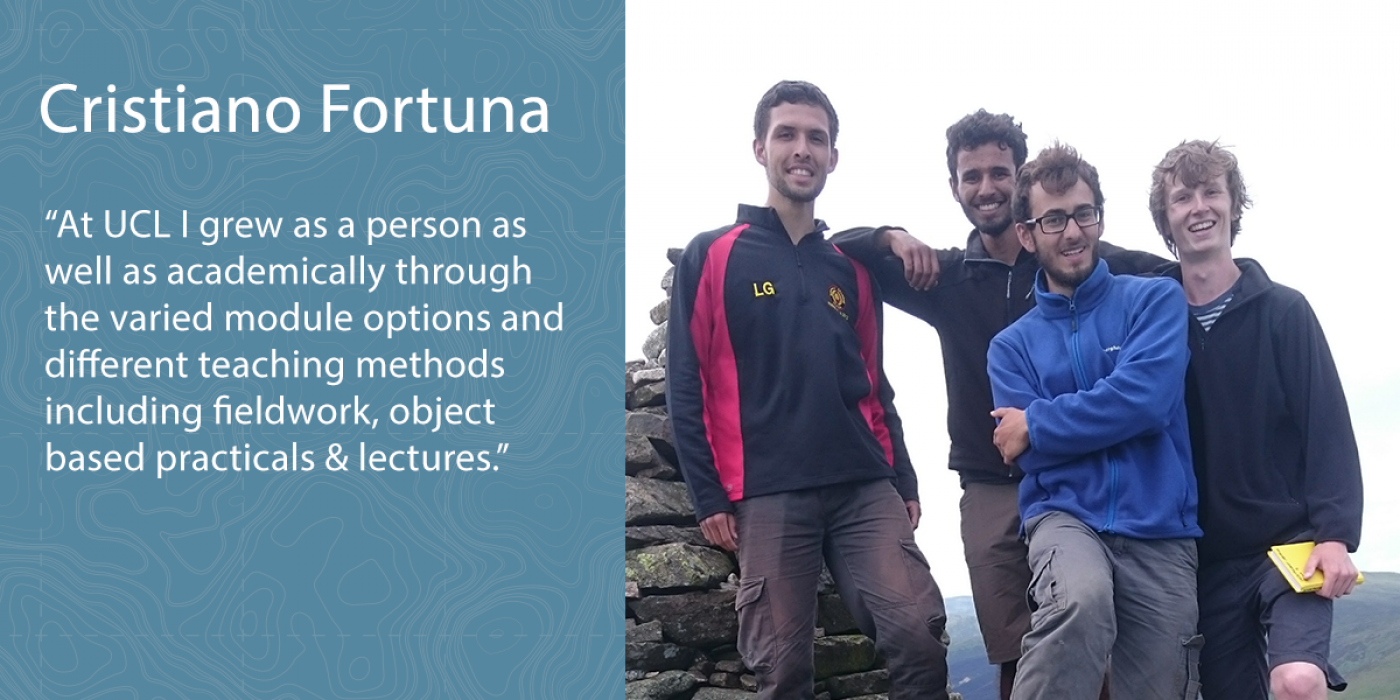
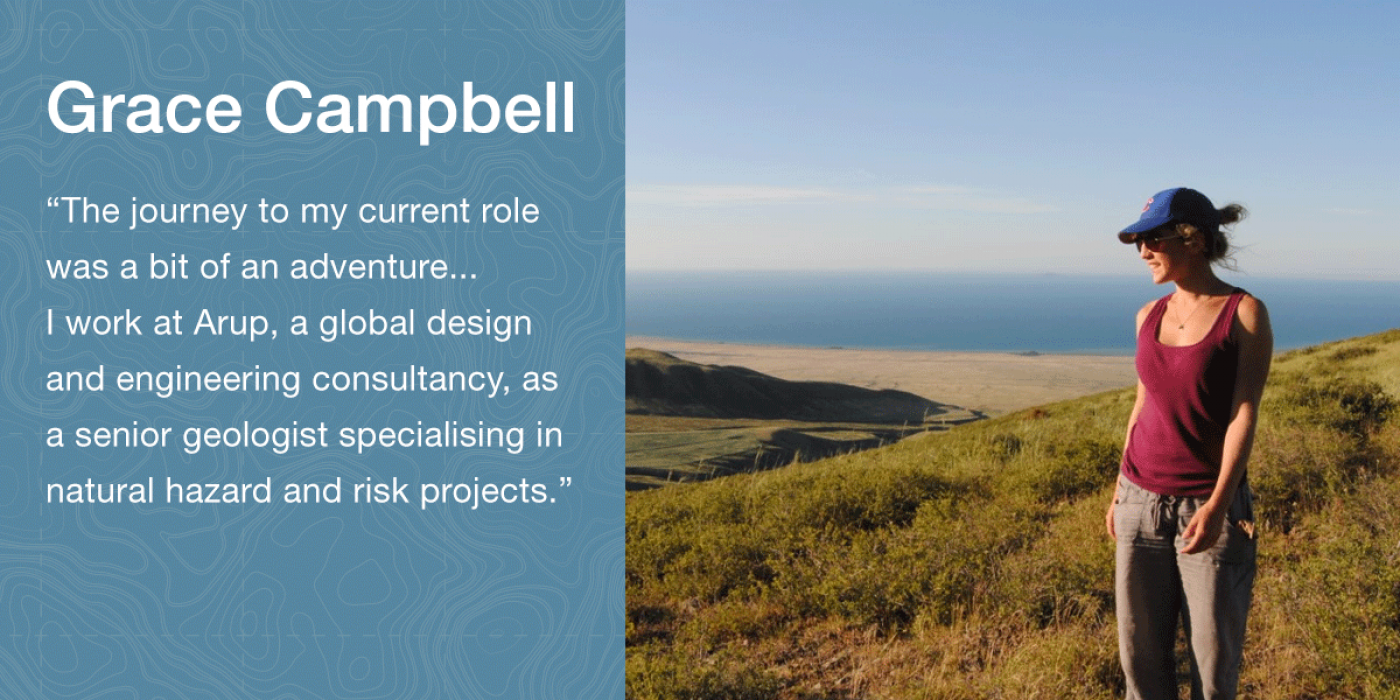
See what our students got up to when they were studying with us and where they are now.
Follow us:
View our X profile @ES_UCL
![]()