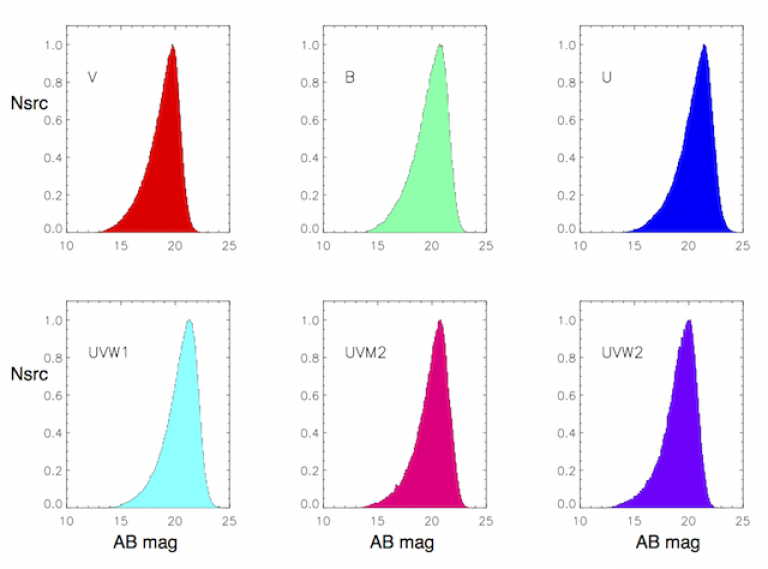
Fig. 1 plots source magnitude distributions within the XMM-SUSS2, separated by filter. Only those sources with no quality issues are included.

Figure 1: The normalized magnitude distributions of quality = 0 sources with detection significances > 3σ contained within the XMM-SUSS2 catalogue.
Unlike the sharp, artificial cut-offs displayed by the source significance distributions at the low-brightness end, the UV faint-magnitude distributions cut off more gradually and this is the consequence both of non-uniform exposure lengths and time-variable background levels, resulting in a range of image depth.
Comparing the depth of the XMM-SUSS2 catalogue with the GALEX All-sky Imaging Survey(AIS) reaching mAB = 20.5 in the NUV filter, the two samples are complementary, the OM data adding more detailed spectral information to existing GALEX fields.
Photometric Accuracy
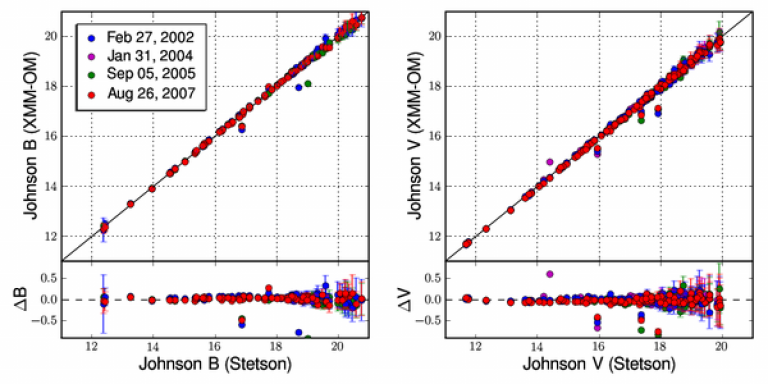
Throughout the mission, XMM-OM photometry has been calibrated against IUE and HST STISUV spectrophotometric standards, and Stetson optical source magnitude measurements in the Landolt standard field SA95. Figure 2 provides a comparison of optical XMM-OM and Stetson photometric meaurements from this field over four epochs. Two-colour corrections have been performed on the OM data to adjust magnitudes to the Johnson B and V bandpasses using the onversion coefficients given in the Calibration Status document, supplied within the XMM calibration layer. Since UV calibrations are performed against spectrophotometric stars rather than standard fields, a similar UV filter plot cannot be made, but a quantitative description of the UV photometric calibration is provided in the Calibration Status document.

Figure 2: Comparison of XMM-OM SUSS magnitudes and Stetson source magnitudes in the Landolt standard field SA95. XMM-OM magnitudes have been colour-corrected to the Johnson filer system. Lower panels provide the difference between the two measurements. XMM-OM sources were detected over four separate epochs.
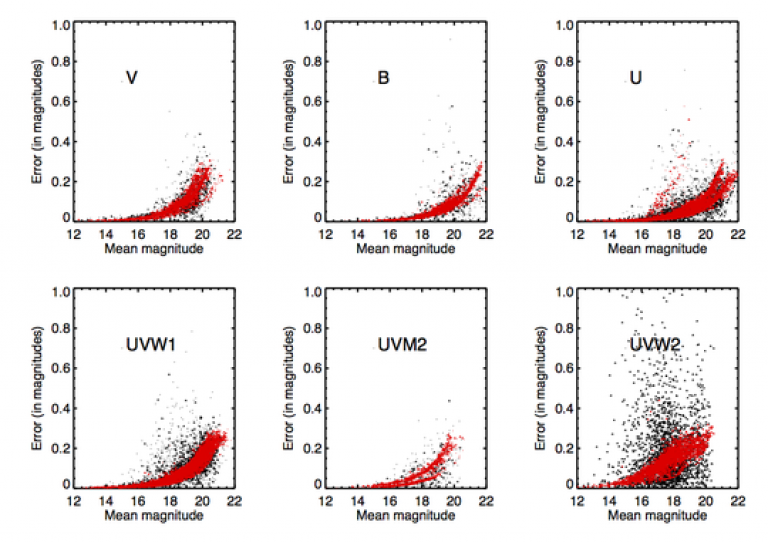
Since multiple images of the same field are often obtained, we can, neglecting variable objects, characterize the accuracy of OM photometry by comparing the variation in the sources over time. Figure 3 compares the variances of sources detected more than three times with the mean of the magnitude errors provided by the OM aperture photometry algorithm performed within the SAS pipeline. The good agreement between statistical variability and calculated error is an endorsement for the photometric quality of the catalogue. However, the scatter in the repeated measurements generally exceeds the scatter which we would expect from the photometric errors. This can be understood as being due to the influence of stray light. The stray light pattern, being different in different frames, changes the magnitudes of the affected stars in various directions, increasing their scatter and thus increasing the variance based on these magnitudes. Simulations show that the level of stray light needed to produce the distribution seen is quite low, so its presence may not be visually evident. One has to assume 20-30% of stars in the field are affected by stray light.
In some cases the red points seem to be divided into two distributions. This is due to the fact that some of the sources were detected on stacked images.

Figure 3: In this plot the errors are plotted against the mean magnitude calculated from the repeated observations in one sixth part of XMM-SUSS2. The black points are the RMS variations of multiply-detected sources, the red points indicate the computed 1 σ count rate errors given in the catalogue.
 Close
Close

