 Close
Close

Alzheimer’s and Parkinson’s diseases (AD and PD) are the commonest degenerative neurological disorders of old age.
There are many rarer disorders such as progressive supranuclear palsy (PSP), corticobasal degeneration (CBD) and beta-propellor protein associated degeneration (BPAN) that variably share clinical and pathological features.
Research to date has uncovered three crucial processes within the cell that are major contributors to malfunction and cell loss. These include clustering of individual cellular proteins to form insoluble aggregates, dysfunction of mitochondria, the energy generators within the cell, and autophagy, the cellular process to eliminate damaged components including the defective mitochondria and large protein aggregates.
Cell biology of neurodegeneration
Our research primarily involves the study of cell models of neurodegeneration, developing “disease-in-a-dish” to study the cellular processes involved in nerve cell death.
Of particular importance is work with patient-derived skin cells that can be differentiated into relevant nerve cell types via induced pluripotent stem cells (iPSCs).
This gives the opportunity to study cell defects within the context of the patient’s own unique genetic background and interacting genetic risk factors that singly or collectively contribute to disease propensity.
Clinico-pathological studies of neurodegenerative disorders
Our clinical work focuses on movement disorders and dementias, including PSP, CBD, BPAN that present at the National Hospital of Neurology and Neurosurgery (NHNN) at Queen Square. Being the largest neurology referral centre in the country, this gives the opportunity to investigate the more unusual presentations.
Current projects include looking at the neurobehavioural and cognitive complications of Parkinson’s disease. In collaboration with the Queen Square Brain Bank and our colleagues in the UCL Queen Square Institute of Neurology, we are able to carry out detailed neuropathological and genetic investigations of these disorders and have produced important papers describing the classification, staging and genetic correlates of these devastating disorders.
Recent Publications
Elevated 4R-tau in astrocytes from asymptomatic carriers of the MAPT 10+16 intronic mutation
Núria Setó-Salvia, Noemi Esteras, Rohan de Silva, Eduardo de Pablo-Fernandez, Charles Arber, Christina E. Toomey, James M. Polke, Huw R. Morris, Jonathan D. Rohrer, Andrey Y. Abramov, Rickie Patani, Selina Wray, Thomas T. Warner
"Journal of Cellular and Molecular Medicine" December 2021
Abstract
The microtubule-associated protein tau gene (MAPT) 10+16 intronic mutation causes frontotemporal lobar degeneration (FTLD) by increasing expression of four-repeat (4R)-tau isoforms. We investigated the potential role for astrocytes in the pathogenesis of FTLD by studying the expression of 4R-tau. We derived astrocytes and neurons from induced pluripotent stem cells from two asymptomatic 10+16 carriers which, compared to controls, showed persistently increased 4R:3R-tau transcript and protein ratios in both cell types. However, beyond 300 days culture, 10+16 neurons showed less marked increase of this 4R:3R-tau transcript ratio compared to astrocytes. Interestingly, throughout maturation, both 10+16 carriers consistently displayed different 4R:3R-tau transcript and protein ratios. These elevated levels of 4R-tau in astrocytes implicate glial cells in the pathogenic process and also suggests a cell-type-specific regulation and may inform and help on treatment of pre-clinical tauopathies.
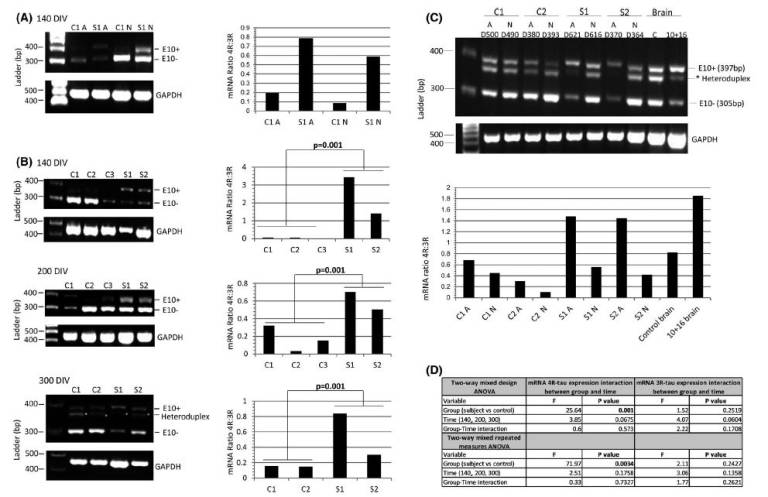 Fig.1: The mRNA 4R:3R-tau levels in controls and 10+16 asymptomatic carriers at 140–300 DIV. (A) The mRNA 4R-tau levels were analysed between astrocytes (A) and neurons (N) at 140 DIV. Ratios of 4R-tau relative to 3R-tau expression in astrocytes with or without mutation were higher compared with neurons at same time-point. (B) Astrocytes at different DIV were analysed to determine the levels of 4R-tau expression between controls and patients. Astrocytes with the 10+16 mutation expressed elevated 4R:3R-tau mRNA ratio compared to controls and these values were consistent in the different time-points. (C) Analysis of the 4R:3R-tau mRNA between astrocytes and neurons after 370–620 DIV. Standard and fluorescent PCR of mRNA tau expression was performed to confirm the intermediate band (asterisk) as heteroduplex artefact and discard from quantification. The two PCR products at 397bp and 305bp correspond to 4R (exon 10+) and 3R-tau (exon 10−), respectively. An affected 10+16 post-mortem brain tissue and a healthy age-matched donor samples were included in the analysis. The astrocytes (A) (with and without mutation) showed an increased 4R:3R-tau mRNA ratio compared with neurons (N) at same time-point. The 3R and 4R-tau expression pattern differed also between controls and 10+16 carrier cell lines (also see Figure S3). (D) A Shapiro-Wilk test was used to assess normality of distribution (Figure 1B). When variables were not normally distributed data were subjected to a log transformation. A two-way mixed design ANOVA and a two-way mixed repeated measures ANOVA was used to compare the results of the outcome variable (4R) with time (100, 200 and 300 DIV) as within-patients variables and group (case versus control) as a between-patients variable for three repetitions and four repetitions separately. The mRNA 4R-tau expression in astrocytes at different time points showed statistically significant differences between carriers and controls and 4R-tau expression did not show significant differences over time (140, 200 and 300 DIV) or the interaction between disease group and time. The mRNA results for expression in 3R-tau showed no significant differences among cases vs. controls, over time or with the interaction between group and time (Figure 1B) (also see Table S1) |
| ||
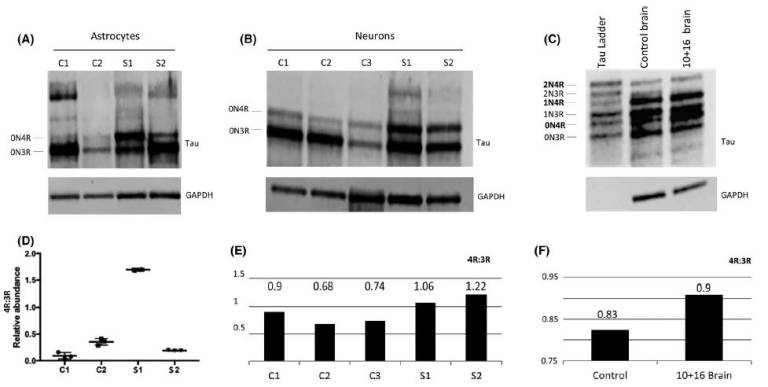 Fig.2: Protein analysis of total tau derived-astrocytes and neurons at 300 DIV and brain donor samples. (A) Differences in tau isoform levels were identified in both astrocyte cell line carriers. The S1 sample showed increased 0N4R isoform compared to S2. (B) Increased 0N4R isoform was also seen in neurons, although S1 still showed an increased pattern of 0N4R compared to S2. (C) Frontal cortex samples from a 10+16 brain donor and control brain also showed increased 0N4R band in the 10+16 brain sample compared to control. (D) The statistical analysis used was ANOVA with post-hoc Tukey. Significant differences in 4R-tau levels between S1 and controls and S2 samples were identified (also see Figure S5). (E) Quantification graph of the western blot for total 4R:3R isoforms between controls and iPSC-derived neurons after 300 DIV. The ratio values show increased 4R in both patients compared to controls. (F) Quantification graph of the western blot for total 4R:3R isoforms between healthy brain donor and 10+16 brain patient. The 10+16 brain patient show an increased accumulation of total 4R tau isoforms versus total 3R tau isoforms compared to healthy brain Fig. 3
|
|
Association Between Orthostatic Hypotension and Dementia in Patients With Parkinson Disease and
Multiple System Atrophy
Iñigo Ruiz Barrio, Yasuo Miki, Zane T. Jaunmuktane, Thomas Warner, Eduardo De Pablo-Fernandez
Abstract
Background and Objectives: Orthostatic hypotension (OH) increases dementia risk in patients with Parkinson disease (PD), although the underlying mechanisms and whether a similar association between OH and cognitive impairment exists in other synucleinopathies remain unknown. The aim is to evaluate the association between OH and dementia risk in patients with PD, and cognitive impairment risk in patients with multiple system atrophy (MSA), and to explore relevant clinical and neuropathologic factors to understand underlying pathogenic mechanisms.
Methods: This is a retrospective cohort study. Medical records throughout the entire disease course of consecutive patients with neuropathology-confirmed PD and MSA from the Queen Square
Brain Bank were systematically reviewed. Time of onset and severity of OH-related symptoms were documented, and their association with other clinical and neuropathologic variables was
evaluated. Dementia risk for patients with PD and cognitive impairment risk for patients with MSA were estimated using multivariable hazard regression.
Results: One hundred thirty-two patients with PD and 137 with MSA were included. Patients with MSA developed OH more frequently, earlier in the disease course and with more severe symptoms. Cumulative dementia prevalence was higher in patients with PD. Multivariable adjusted regression models showed that early OH, but not its symptom severity, increased dementia risk in patients with PD by 14% per year (hazard ratio [HR] = 0.86; 95% CI, 0.80-0.93) and cognitive impairment risk in patients with MSA by 41% per year (HR = 0.59; 95% CI, 0.42-0.83). Early OH was not associated with increased α-synuclein, β-amyloid, tau, Alzheimer, or cerebrovascular pathologies. No significant associations were found between severity of OH symptoms and other clinical or neuropathologic variables.
.
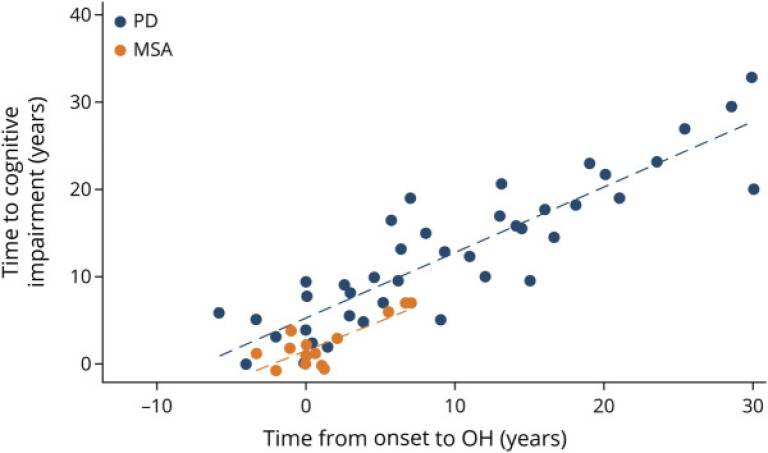 | Fig 1. Scatterplot Showing the Association Between Time of Onset of Orthostatic Hypotension and Time to Development of Cognitive Impairment for Cases With MSA (Orange) and Dementia for PD Cases (Blue) |
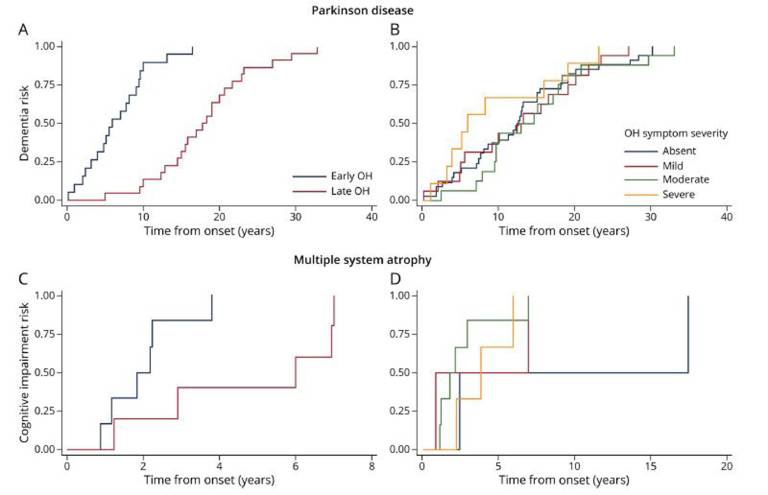 | Fig 2. Kaplan-Meier of Cumulative Risk of Dementia in PD and Risk of Cognitive Impairment in MSA by Time of Onset of Orthostatic Hypotension (A) and (C) and Severity of Symptoms of Orthostatic Hypotension (B) and (D) |
Neuroimaging correlates of brain injury in Wilson's disease: a multimodal, whole-brain MRI study
Abstract
Wilson's disease is an autosomal-recessive disorder of copper metabolism with neurological and hepatic presentations. Chelation therapy is used to 'de-copper' patients but neurological outcomes remain unpredictable. A range of neuroimaging abnormalities have been described and may provide insights into disease mechanisms, in addition to prognostic and monitoring biomarkers. Previous quantitative MRI analyses have focused on specific sequences or regions of interest, often stratifying chronically treated patients according to persisting symptoms as opposed to initial presentation. In this cross-sectional study, we performed a combination of unbiased, whole-brain analyses on T1-weighted, fluid-attenuated inversion recovery, diffusion-weighted and susceptibility-weighted imaging data from 40 prospectively recruited patients with Wilson's disease (age range 16-68). We compared patients with neurological (n = 23) and hepatic (n = 17) presentations to determine the neuroradiological sequelae of the initial brain injury. We also subcategorized patients according to recent neurological status, classifying those with neurological presentations or deterioration in the preceding 6 months as having 'active' disease. This allowed us to compare patients with active (n = 5) and stable (n = 35) disease and identify imaging correlates for persistent neurological deficits and copper indices in chronically treated, stable patients. Using a combination of voxel-based morphometry and region-of-interest volumetric analyses, we demonstrate that grey matter volumes are lower in the basal ganglia, thalamus, brainstem, cerebellum, anterior insula and orbitofrontal cortex when comparing patients with neurological and hepatic presentations. In chronically treated, stable patients, the severity of neurological deficits correlated with grey matter volumes in similar, predominantly subcortical regions. In contrast, the severity of neurological deficits did not correlate with the volume of white matter hyperintensities, calculated using an automated lesion segmentation algorithm. Using tract-based spatial statistics, increasing neurological severity in chronically treated patients was associated with decreasing axial diffusivity in white matter tracts whereas increasing serum non-caeruloplasmin-bound ('free') copper and active disease were associated with distinct patterns of increasing mean, axial and radial diffusivity. Whole-brain quantitative susceptibility mapping identified increased iron deposition in the putamen, cingulate and medial frontal cortices of patients with neurological presentations relative to those with hepatic presentations and neurological severity was associated with iron deposition in widespread cortical regions in chronically treated patients. Our data indicate that composite measures of subcortical atrophy provide useful prognostic biomarkers, whereas abnormal mean, axial and radial diffusivity are promising monitoring biomarkers. Finally, deposition of brain iron in response to copper accumulation may directly contribute to neurodegeneration in Wilson's disease..

Fig 5. TBSS for disease status.