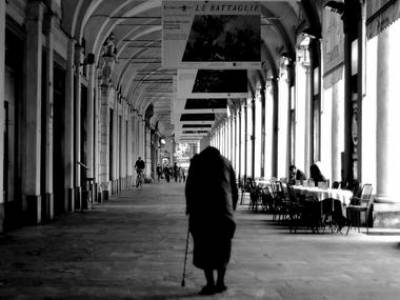
Turin is located in the Piedmont Region, situated in the North-western part of Italy. Situated on the Po River (as well as the Stura di Lanzo, Sangone and the Dora Riparia Rivers), Turin is surrounded by the Alpine arch. Turin is a small city as its land area spans 130.2 km squared. In 2005, the population size was 888,768 (Men: 422,926 l Women: 465,836) with a population density of 6975.9 inhabitants per km squared.
As Turin's population has progressively aged over the
last four decades, about one-quarter (23.4%) of the city population are 65 years
or older. This makes Turin the city with
the largest relative ageing population of the INEQ-CITIES Atlas. This age
profile corresponds with a small proportion of youth; only 11.4% of the
population are between the ages of 0 - 14, the lowest among the cities included
in the INEQ-CITIES Atlas. Turin is a
major hub for national and regional industry and trade. As such, industrial
services employ a large number of the active work force, followed by the
service, tourism and retail sectors.
- City Profile
-
Turin has a specific demographic profile, defined by an ageing population. Demographic figures from the 2005 Census collected by the Municipality Population Registry are shown below:
- Population aged 0 - 14: 11.4%
- Population aged 65 and older: 23.4%
- Population aged 16 - 64 in the labour market: 67.8%
- Unemployment: 11.4%
- Immigrant population: 5.6%
- Methods
-
Socio-economic and mortality analyses were conducted at a small area-level within each city. The maps of Turin represent 2,666 Census Tracts or small areas. Data from the 2000 - 2008 Turin Registry Office was used to obtain the population size per Census Tract.
The 2,666 Census Tracts studied by INEQ-CITIES were aggregated from 3,701 Census Tracts, the total number of small areas in Turin. Neighbouring Census Tracts were aggregated if they had similar levels of socio-economic deprivation, measured by the socio-economic indicators shown in this Atlas. Aggregation was performed to enable statistical analysis of sparsely populated areas. The INEQ-CITIES research of Turin is based on these figures.
The table below shows the estimated population size per Census Tract by first, second (median) and third quartiles, based on 2004 figures from the Turin Registry Office. Due to the large number of Census Tracts in Turin, the population size per small area is very small.
Population Size per Small Area, Turin Men Women First Quartile
87 96 Median 130 144 Third Quartile
196 215 - Socio-Economic Indicator Maps
-
Social inequalities were examined using markers of deprivation to assess geographical segregation according to socio-economic characteristics. Find out more about socio-economic inequalities within Turin by viewing area-level maps of Socio-Economic Indicators of:
- Mortality Maps
-
Mortality ratios were examined for all-cause mortality and disease-specific mortality, separately for men and women. Find out more about health inequalities within Turin by viewing area-level maps of:
- Resources
-
For further information about health inequality and the INEQ-CITIES research conducted in Turin, please go to:

 Close
Close


