Digital 3D models of London chart path to lower emissions
11 September 2020
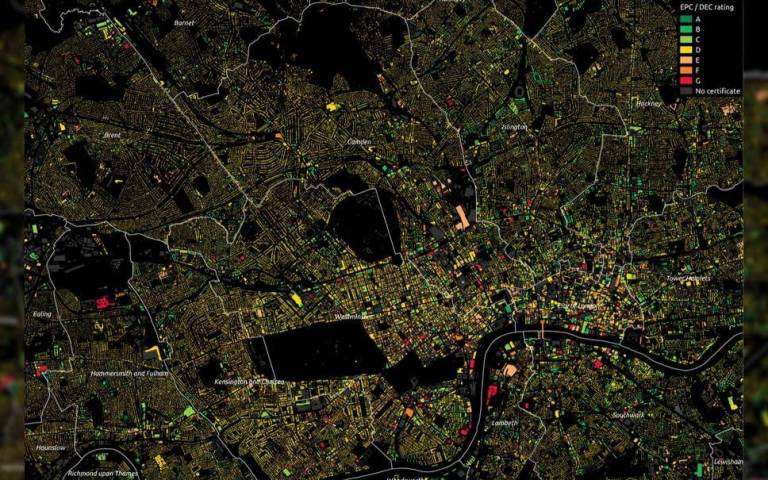
An interactive 3D map of London that grades the energy efficiency of more than 3.5 million properties has been built by UCL researchers for the Greater London Authority (GLA) to inform efforts in tackling fuel poverty and reducing carbon emissions.

The London Building Stock Model, created by a team at the UCL Energy Institute and the UCL Centre for Advanced Spatial Analysis, contains detailed data on every single domestic and non-domestic property in all 33 London boroughs, including the age of buildings, their 3D proportions, construction materials, servicing systems, and the nature of the activities on each floor of commercial and public buildings, as well as an energy efficiency grading for each building.
The digital model, which took two years to build, can be used to identify energy inefficient buildings and to help local authorities tackle fuel poverty as well as guide retrofit programmes to improve the energy efficiency of the building stock.
A second model, the London Solar Opportunity Map, reveals the solar energy potentially available from all roofs and open land across Greater London, either in the form of electricity from photovoltaic (PV) installations or heat from solar thermal collectors.
The map, which calculates the amounts of sunshine and diffuse solar radiation falling annually on all surfaces, takes into account overshadowing by trees and other buildings as well as the slopes of surfaces. It is intended for use by homeowners, policymakers, investors and solar power installers.
Professor Philip Steadman (UCL Energy Institute) said: “These tools can help to improve the energy efficiency of London’s building stock and can be used to guide investment in increased solar energy. Both digital models will support efforts in lowering London’s carbon emissions.
“The London Building Stock Model will, for the first time, allow the energy efficiency of every building in Greater London to be available to view online. It can identify outliers – for instance, a building that is performing poorly compared to other similar properties on the same street – and guide retrofitting interventions.”
Professor Paul Ruyssevelt (UCL Energy Institute) said: “In other digital models of cities, the buildings are for the most part empty boxes. The London Building Stock Model, on the other hand, draws information from multiple data sources to give extensive detail about each building.”
About half of the energy efficiency gradings are drawn from Energy Performance Certificates (EPC) and Display Energy Certificates attached to each building, while the other half are inferred from the building’s characteristics.
The London Solar Opportunity Map, also created by researchers at the UCL Energy Institute and the UCL Centre for Advanced Spatial Analysis, is based on a 3D model of terrain, buildings, other structures and trees derived from LiDAR – laser measurements made from overflying aircraft. It is intended to support the achievement of the London Mayor’s target of one gigawatt of installed solar power by 2030, and two gigawatts by 2050.
Steve Evans (UCL Energy Institute) said: “Early analysis of the map shows that around a quarter of the Mayor’s two gigawatt target could be met with PV on the roofs of 4,000 large warehouses. Alternatively, the entire two gigawatts could be achieved with installations on a third of a million houses, the majority of them built before 1939.”
The character of land surfaces and their suitability for solar are represented in the Map: some areas such as roads, woodlands and Royal Parks are excluded. The Map is linked to the London Building Stock Model, which makes it possible to know the uses of buildings under all roofs.
Links
- London Building Stock Model
- London Solar Opportunity Map
- Professor Philip Steadman’s academic profile
- Professor Paul Ruyssevelt’s academic profile
- Steve Evans’s academic profile
- Building Stock Laboratory
- UCL Energy Institute
- UCL Centre for Advanced Spatial Analysis
- The Bartlett, UCL Faculty of the Built Environment
- Greater London Authority
Image
- The 2D version of the London Building Stock Model
Media contact
Mark Greaves
Tel: +44 (0)7539 410 389
Email: m.greaves [at] ucl.ac.uk
 Close
Close

