In Rotterdam, there were 83,576 deaths from all causes over the study period (1996 - 2008). This figure consists of 38,456 male deaths and 45,120 female deaths and is based on data from the Centraal Bureau voor de Statistiek (Statistics Netherlands).
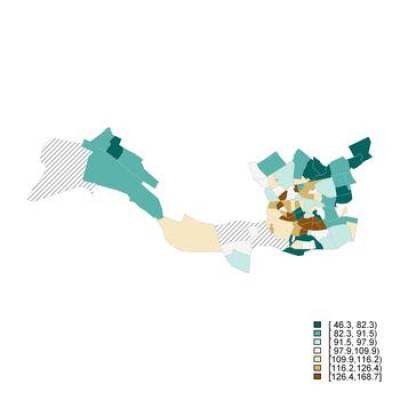
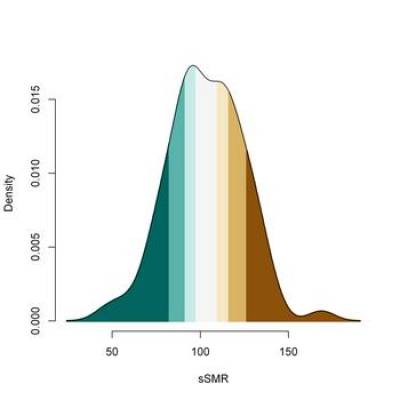
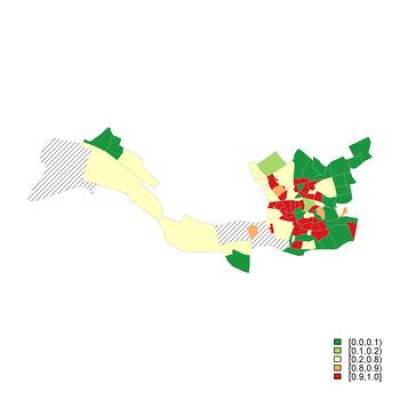
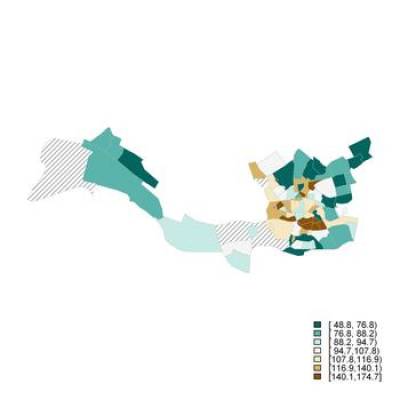
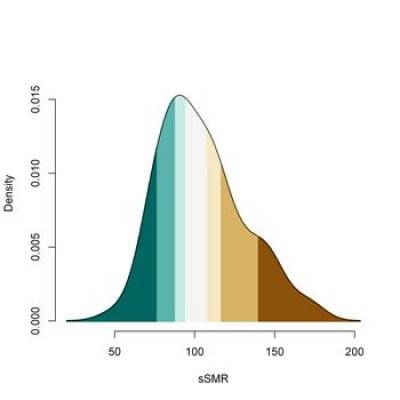
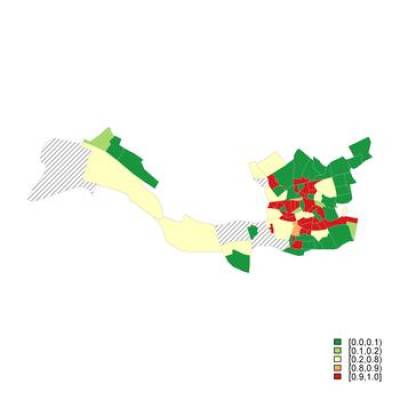
All-cause mortality risk for men and women is highest in the Southern areas of Eastern Rotterdam (shown in dark brown). Although low sSMRs (represented by green tones) are evident throughout the city, the lowest deficits of all-cause mortality are observed in the North-West and North-East of Rotterdam, which mark the boroughs of Hoek van Holland, Prins Alexander Noord and Prins Alexander Oost. The North-South divide in the spatial distribution of mortality risk in Rotterdam follows the geographical segregation observed by the socio-economic indicators of unemployment and primary education.
The following maps of mortality risk in Rotterdam have been amplified in order to make small areas more visible. For further information about how these maps were created, please visit the methodological section of the Atlas. Click on each image for a full-screen view of the maps below.
 Close
Close


