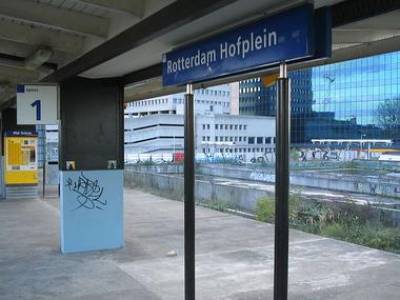
Rotterdam is the second largest city in the Netherlands and is located in the province of South Holland, on the Nieuwe Maas River. Whilst the centre of Rotterdam is located 25 kilometres away from the North Sea, the official urban area extends to the Western coast of the Netherlands. Rotterdam spans an area of 205.9 km squared and contains 596,407 (Men: 292,790 l Women: 303,617) inhabitants. As such, it is the second smallest city included in the INEQ-CITIES Atlas. Due to the low numbers of inhabitants in the Western harbour, the city's population density is 2912.5 inhabitants per km squared.
Rotterdam
has the second highest immigration rate of the cities in the INEQ-CITIES Atlas,
matched only by neighbouring Amsterdam. This makes Rotterdam one of Europe's
most diverse cities. Due to its international
harbour and strategic location on the Rhine-Meuse-Scheldt delta, Rotterdam is a
focus point for trade and transport. As such, the industrial services employ
8.3% of Rotterdam's active members of the labour force, whilst the service
sectors accounts for 91.6% and primary industries account for only 0.1%.
- City Profile
-
Rotterdam has a specific demographic profile, defined by a young population and an extremely high proportion of immigrants. Demographic figures collected in 2001 from CBS Statline, Gemeente Rotterdam and COS Omnibusenquête are shown below:
- Population aged 0 - 14: 17.2%
- Population aged 65 and older: 14.3%
- Population aged 16 - 64 in the labour market: 69%
- Unemployment: 9%
- Immigrant population: 45%
- Methods
-
Socio-economic and mortality analyses were conducted at a small area-level within each city. The maps of Rotterdam represent 88 Buurts (Neighbourhoods) or small areas. Data from 2001 provided by the Centraal Bureau voor de Statistiek was used to obtain the population size per Buurt.
As the population size per small area was only available for 2001, the population figures for 2001 were multiplied by twelve to represent the total number of years included in the study period (1996 - 2008). It is worth noting that the Census in Rotterdam is based on a population sample rather than a measure of the entire population. Some Buurts, therefore, had small sample sizes, such as the harbour areas in Western Rotterdam. Buurts with five or less cases (by sex for any indicator) were excluded from the analysis and are shown in stripes on the Atlas maps. The INEQ-CITIES research of Rotterdam is based on these figures.
The table below shows the estimated population size per Buurt by first, second (median) and third quartiles, based on 2001 figures from the Centraal Bureau voor de Statistiek.
Population Size per Small Area, Rotterdam Men Women First Quartile
417 414 Median 3,276 3,260 Third Quartile
5,466 5,273 - Socio-Economic Indicator Maps
-
Social inequalities were examined using markers of deprivation to assess geographical segregation according to socio-economic characteristics. Find out more about socio-economic inequalities within Rotterdam by viewing area-level maps of Socio-Economic Indicators of:
- Mortality Maps
-
Mortality ratios were examined for all-cause mortality and disease-specific mortality, separately for men and women. Find out more about health inequalities within Rotterdam by viewing area-level maps of:
- Resources
-
For further information about health inequality and the INEQ-CITIES research conducted in Rotterdam, please go to:

 Close
Close


