Life expectancy rises 'grinding to halt'
19 July 2017
Life expectancy is starting to slow or even stop in England after decades of increase, according to high-impact research by Sir Michael Marmot, Director of UCL's Institute of Health Equity, in the Institute's 2017 Marmot Indicators release.

Using data from the Office for National Statistics, Sir Michael's research, widely reported in the media, has shown that the rate of increase in life expectancy has dropped by almost 50% since 2010. Between 2000 and 2015, life expectancy at birth increased by one year every five years for women and by one year every 3.5 years for men. Post-2010, however, life expectancy for women has only increased by one year every 10 years, with men's life expectancy increasing by one year every six years.
Sir Michael says this shows that life expectancy growth is "pretty close to having ground to a halt", which is "historically highly unusual" given the increases seen over the past century. "I am deeply concerned with the levelling off, I expected it to keep getting better," the Epidemiology and Public Health Professor commented, noting that although conclusions about the lack of increase are not readily apparent, it is "entirely possible" austerity has had an impact.
Indeed, Sir Michael believes it should be "matter of urgency" to work out exactly what is behind the trend for slowing life expectancy growth in England, dismissing the idea that the decrease in rising rates is because humans are reaching the limits of their natural lifespans. Current average life expectancy in England is 83 for women and 79.4 for men, with recent controversial research suggesting the upper limit for human life should stretch to 115.
Remaining Life Expectancy and Dementia
Other important findings in the 2017 Marmot Indicators include the slowing of remaining life expectancy in England (in those aged 65 and over), the increase in deaths from dementia and Alzheimer's, and the relationship between social determinants of health and life expectancy, in terms of inequality, education and employment.
Remaining life expectancy at age 65, which had been increasing at a rate of one year every six years for women and every five years for men, has significantly reduced to a one year increase every 16 years for women and every nine years for men. The increasing role played by deaths at older ages can go some way to explaining this trend; three out of four deaths to women are at ages 75 and over, with two thirds of these occurring at ages 85 and over. For men, the respective figures are three out of five deaths are at ages 75 and over, with half of these at ages 85 and over. The sustained increase in this age range - improved survival in old age, plus historical events such as the 1920s baby boom - has placed substantial pressures on all forms of social protection, such as health, social care and pensions.
At the same time there has been an increase in the recognition of age-related degenerative mental health conditions. Sir Michael's research shows us that dementia and Alzheimer's are now the most common cause of death in women aged 80 and over (37,252 deaths) and in men aged 85 and over (12,258 deaths) i.e. at the most common ages at which people now die.
Between 2002 and 2015, there was a c. 175% increase in dementia as a contributing cause of death in women aged 85 and over and a 250% increase for men. While the largest contributor to this (particularly among women) was the increase in the rate of identifying dementia in the population, there were also substantial increases as a result of having a larger population within the older age ranges (and, separately, the combined effect of having a higher rate in a substantially increased population).
The implications for services of both a greater rate of dementia at death and a relatively rapid increase in the population at the most vulnerable ages is considerable. As Sir Michael comments, if the government doesn't '…spend appropriately on social care…[or] appropriately on health care, the quality of life will get worse for older people and maybe the length of life, too.' Although resources in health and social services have, in many areas, been maintained at previous levels (in contrast to cuts in other services), the pressures identified within the Indicators suggest that "standing still" is not a sufficient response.
Inequality
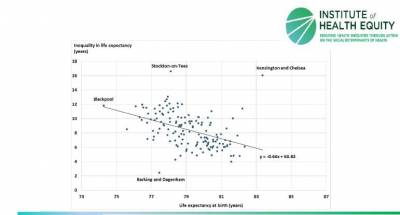
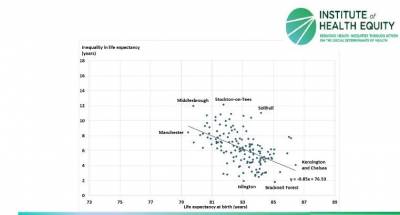
The 2017 Marmot Indicators clearly show that inequalities in life expectancy between and within local authorities have persisted. Life expectancy for men varied from 74 in Blackpool to 83 in Kensington and Chelsea - a nine-year gap. Among women it varied from 79 in Manchester to 86 in Kensington and Chelsea - a seven-year gap.
Within local authorities there was considerable variation in the inequality gradient in life expectancy between small areas based on level of deprivation. For men, in Barking and Dagenham these inequalities were equivalent to a two and a half year gap while in Stockton on Tees and Kensington and Chelsea the figures exceeded 16 years.
Male life expectancy at birth and inequalities in life expectancy by local authority

Female life expectancy at birth and inequalities in life expectancy by local authority

Health life expectancy - the years an average individual can expect to live in good health - strongly relate to overall life expectancy, according to the Office for National Statistics Data. Tower Hamlets proved an exception, however, with the gap between healthy life expectancy and life expectancy (i.e. years spent in ill-health) being considerably greater than that for other local authorities (30 years for females and 24 years for males).
Education
The 2017 Marmot Indicators also show the importance of education in reducing inequalities. Good Early Years Development has a profound and lasting impact on prospects and health in later life. Latest figures on early child development at age 5 illustrate impressive improvement.
In 2012/13 only half of children reached a good level of development, and a third of children eligible for free school meals reached a good level of development. In 2015/16, just under 70% reached a good level of development and over half of children on free school meals reached this level. The gap has reduced slightly but not significantly.
However, there are areas where children on free school meals are doing much better; over 67% of those on free school meals in Haringey, Lewisham, Bexley and Greenwich reached a good level of development in 2015/16, whereas less than 40% reached a good level of development in Stockton on Tees, Blackburn and Darwen and Leicestershire, reflecting the variation seen in life expectancy across England - where you live matters.
The Indicators further illustrate wide variation between children eligible for free school meals by region when it comes to GCSE attainment. There was little change in the percentages of children attaining five or more GCSEs including English and Maths, or in the gap between all children and those eligible for free school meals between 2013/14 and 2014/15 (just under 60% of all children attained 5 or more GCSEs, and a third eligible for free school meals attained 5 or more GCSEs).
However, as with Early Years Development, the London region had significantly reduced the gap in GCSE attainment by 2014/15. If the success of children in London was replicated across England, 6% more children not on free school meals would get five or more GCSEs and 37% more children on free school meals would get five or more GCSEs. This would have a significant impact on inequalities.
Standards of Living
The Marmot Indicators suggest that the UK is falling behind other G20 countries, and that despite reductions in unemployment, there have been significant increases in the numbers of people who do not have sufficient income to live an acceptable standard of living since the Marmot Review of 2010.
The Marmot Indicators illustrate that across all regions the numbers not having enough money have increased. In London, the West Midlands, the North East, North West and Merseyside, and Yorkshire and Humberside, 3 out of 10 individuals live in households with insufficient income to meet a healthy standard of living.
Having sufficient income is important for physical and mental health, children's wellbeing and development, and to enable people to afford or be in the mind set to prioritise a healthy lifestyle.
In the news: BBC News, Guardian, ITV.com Evening Standard Telegraph Mail Independent New Scientist Financial Times
Twitter: @MichaelMarmot
Website: http://www.instituteofhealthequity.org/
 Close
Close


