 Close
Close

How the shipping industry is getting better at measuring emissions
30 January 2019
Tim Scarbrough, Air quality specialist at Ricardo Energy & Environment, writes about their new shipping emissions assessment method which offers major ports around the world previously unavailable insights into their own emissions and associated environmental impacts.
Following the publication of the Clean Air Strategy by the UK Government on 14 January 2019, major English ports are being requested to develop their own air quality strategies by the end of 2019.
This Government recommendation is likely to be a key driver for major English ports to turn their attention to gaining a better understanding of their own situation.
The Government also published their first-ever maritime strategy last week(January 24), which details their vision of a zero-emission shipping industry by 2050.
Over recent years, Ricardo has taken great strides forward in estimating emissions from shipping activity. Recent developments include the adoption of an improved methodology into the UK’s National Atmospheric Emissions Inventory (NAEI). This provides a better understanding of UK shipping emissions and greater accuracy in official Government reporting under international, European and national obligations.
The shipping emissions assessment methodology used by Ricardo (implemented in partnership with UCL Consultants) makes use of Automatic Identification System (AIS) data. This enables the methodology to uniquely identify vessels, and couples their location and speed with a variety of other parameters (e.g. engine power and fuel consumption rate), which provides improved accuracy in emissions estimation at high spatial and temporal resolution.
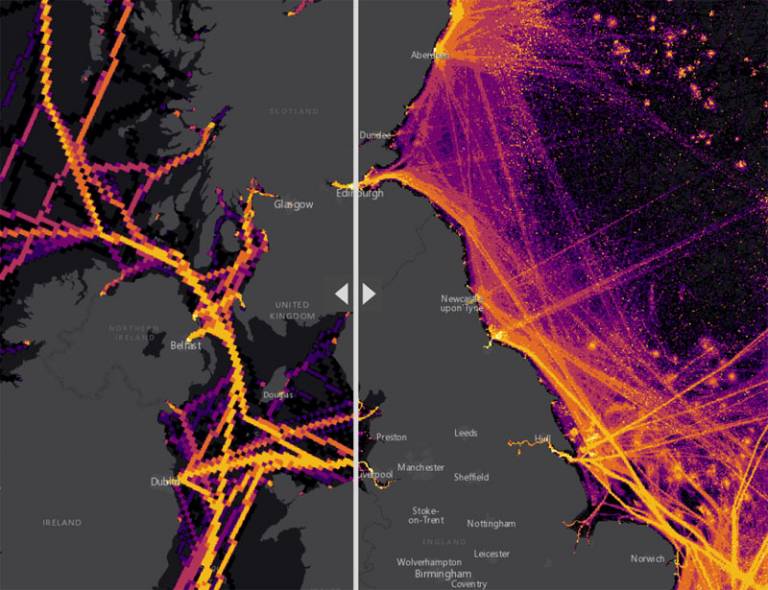
The improvement in the approach over previous methods is striking, as highlighted in this interactive slider map visualisation.
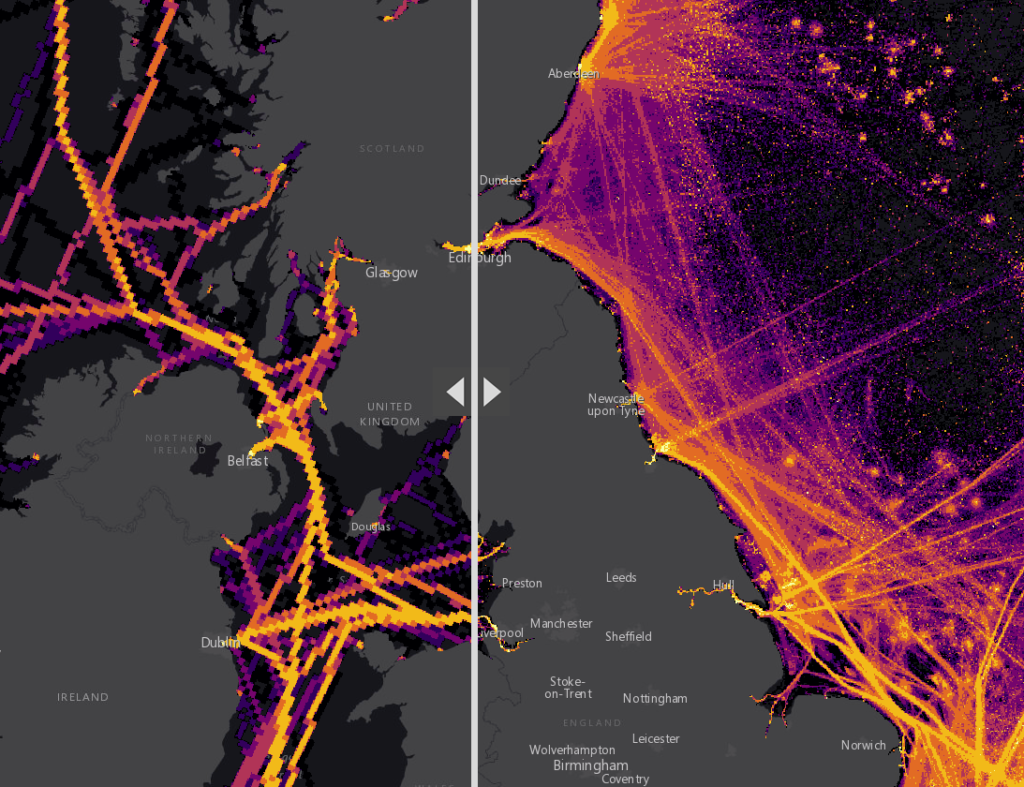 The AIS methodology offers many important insights that were previously unavailable. These include details of:
- Shipping movements – predominantly ferries – between the west coast of Scotland and the Western Isles that were largely absent in previous inventories, but are now better understood.
- The locations of oil and gas platforms in the North Sea that are now evident due to the visible movements of vessels servicing the offshore sector. These movements were mostly absent from the previous inventory.
- Additional routes are now visible off the Norfolk coast, and between Great Britain and Ireland/Northern Ireland, which previously appeared free of shipping activity.
- Activity specific to certain time periods. The AIS data in the slider map for 2014 highlights temporary activities, and associated emissions, related to the construction of the Westernmost Rough Offshore Wind Farm (off the coast from Hull). Subsequent datasets are expected to demonstrate reductions in emissions as the construction phase ends, superseded by routine operation and maintenance activity.
The NAEI map grid provides a resolution of 1km. This resolution provides a useful resource for understanding the contribution of shipping emissions to regional air quality emissions, with estuary and port level granularity highlighting hotspots. However, finer resolution is needed for local scale assessments. Fortunately, the underlying granularity of AIS data allows for further refinement down to the nearest 100 metres. Such granularity provides unparalleled insight into port-scale impacts, enabling far greater understanding of the contribution of emissions to local air quality than previously possible.
Ricardo applied this method of high-resolution emissions analysis to study the contribution of emissions to air quality at the Port of Southampton, as illustrated in the following visualisation:
 At a port level, the contribution of shipping to the total emissions burden is important, but it needs to be considered within the context of emissions from other sources that also have an impact. The quantity, temporal profile and release height of emissions, as well as exhaust gas temperature and flow rate, are all important. In addition, the relative location of emissions in relation to sensitive receptors also impacts the actual pollution burden at any single location within or outside the port. Other emission sources may include port machinery (e.g. straddle carriers, gantry and mobile harbour cranes), road traffic servicing the port, import/export vehicles being driven on/off vehicle carriers, storage of dusty raw materials, onshore power generation and industrial installations.
Taking into consideration all relevant factors, Ricardo assessed and inventoried all emission sources for the Port of Southampton. This involved modelling their contributions to local concentrations of air pollutants using Ricardo’s own city-scale air quality modelling platform – RapidAir.
To explore what this might entail for port operators, Ricardo will be hosting a webinar on air quality challenges and strategies for ports, on Wednesday 20 February from 13:00 to 14:30 GMT.
To register, please visit here or email tim.scarbrough@ricardo.com for more information.
Visit https://ee.ricardo.com/transport/sustainable-ports for more information on AIS modelling and Ricardo’s work with UK ports.
View related story map, with more interactive content here.