The Shape and Pace of Change in Low-Carbon Transitions
This project assessed progress with the low-carbon transition in the electricity and transport sectors through the lens of non-linear ‘S-curve’ technology transitions.

10 June 2021
Overview
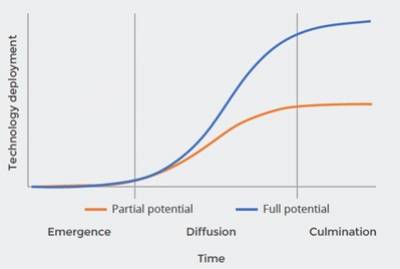
The majority of efforts to examine whether the pace of change toward levels of decarbonisation required to meet the goals of the Paris Agreement implicitly assume that the transition from one set of technologies and characteristics to another is a linear process. But, assessments of the shape and pace of historic transitions has shown that change is highly non-linear. Instead, new technologies tend to emerge onto the market at exponential rates of growth. Over time, rates of growth begin to slow down and technologies diffuse along a more linear trajectory. But, as the technology begins to achieve its final level of market share, rates of growth slow more rapidly and eventually cease. Plotted on a chart, this process looks like ‘S-shaped’ curve, or ‘S-curve’.

The two reports produced under this projects outline the potential dynamics of the transition to net-zero emissions in the global electricity and passenger transport sectors; explain the general principles, characteristics, and common drivers of growth of emerging technologies; and explore progress against metrics of transition in the two sectors. Given that rapid technological progress and diffusion of zero-carbon technologies are critical to reduce emissions at the pace and scale required, these reports look at the deployment levels and rates of change needed to achieve global climate goals, through the shape and pace of change suggested by “S-curve” transitions.
We discover that in the electricity sector, although total CO2 emissions are increasing, the rate at which the key technologies of solar and wind are consistent with that required if they are to follow an S-curve transition to the level of global deployment required under a 1.5-degree target, and that continuing cost reductions in these and other supporting technologies, such as batteries, mean that the required rates of growth are likely to be maintained or even accelerated.
A similar picture is evident in the passenger transport sector. Although CO2 emissions are increasing, the rate at which electric vehicles are growing as a proportion of sales and total stock is consistent with that required for a 1.5-degree target if the transition proceeds under an S-curve, and the rate of cost reductions is likely to see the growth maintained. However, issues such as insufficient investment in charging infrastructure and other supporting policies may prematurely constrain growth and knock progress of track if they are not rapidly addressed.
- Outputs
- The Shape and Pace of Change in the Electricity Transition: Sectoral dynamics and indicators of progress
- The Shape and Pace of Change in the Transport Transition: Sectoral dynamics and indicators of progress (to be published toward the end of May).
- People
- Collaborators
 Close
Close

