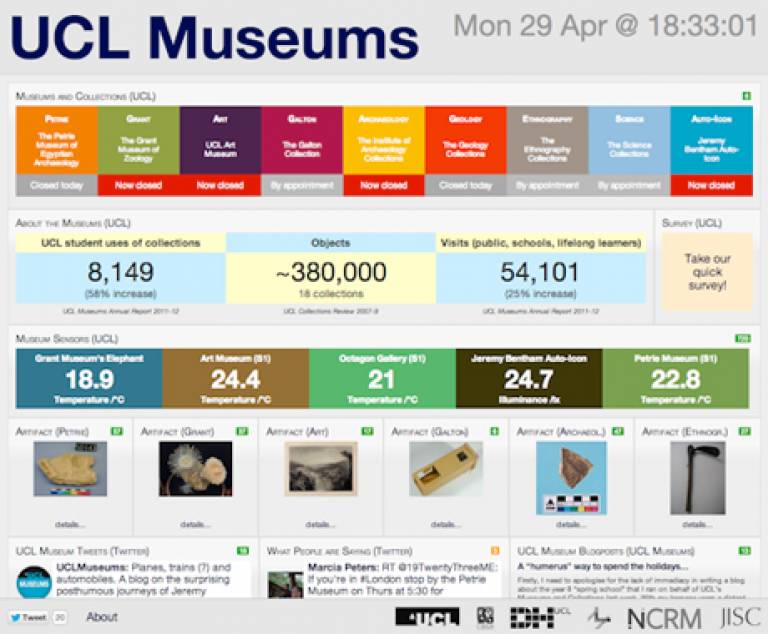
UCL Museums Dashboard launched
29 April 2013

The UCL Museums Dashboard is an adaption of the CityDashboard website, which visualises near-live, rapidly updating and web-accessible data for eight UK cities. The data are displayed on a grid, with colour used to indicate state. By reusing modules and code from the existing website, a working prototype was able to be rapidly developed and launched.
The Dashboard combines bespoke data specifically supplied by UCL Museums, with other relevant data feeds from the surrounding area, including public transport statuses, traffic cameras and air quality measurements. The bespoke data includes opening times across the nine museums and collections managed by UCL, their latest Tweets (both from visitors and the museums themselves), blogposts, and outputs coming direct from a network of sensors within the museums, monitoring ambient temperature in the galleries and even the light level inside UCL founder Jeremy Bentham's Auto-icon. The centrepiece of the dashboard is a display of objects from within six of the museums which have an online catalogue. A random object is chosen and retrieved, with photograph, from the relevant catalogue. The display updates with a new object every ten seconds. A direct link to each object's full catalogue entry is also included.
The UCL Museums Dashboard was made possible by working directly with the technology teams at UCL Museums and UCL Digital Humanities (UCLDH). The project follows on from work done by CASA for UCL Museums and UCLDH including QRator, an interactive question-poser for visitors to the Grant Museum.
 Close
Close

