Close
Close

CASA Spatial Data Visualisation Student Group Projects 2019
2 August 2019
Our 2019 MSc Spatial Data Science and Visualisation students complete their visualisation group projects.
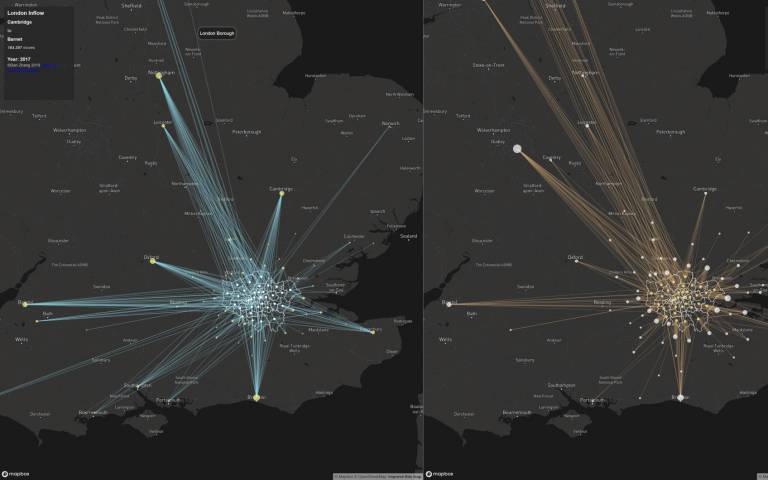
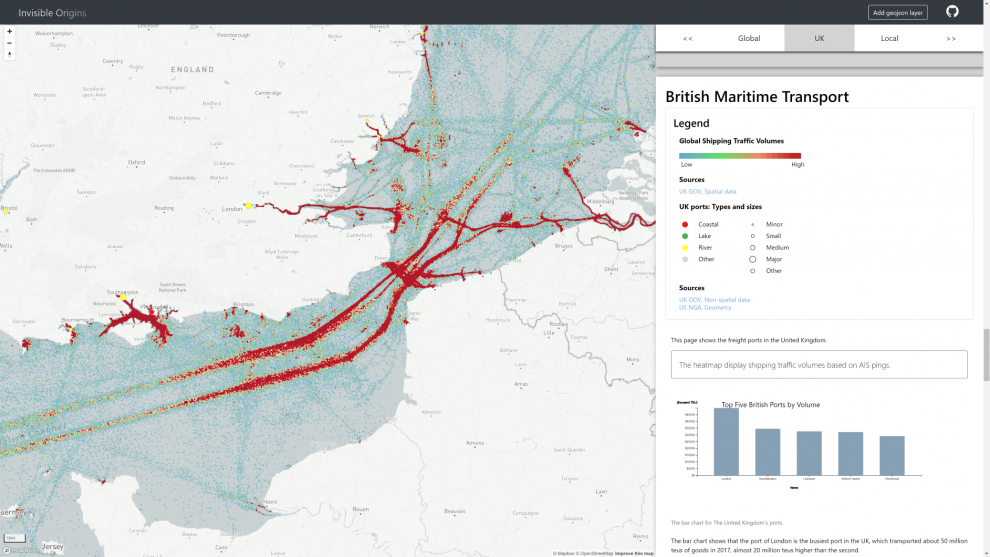
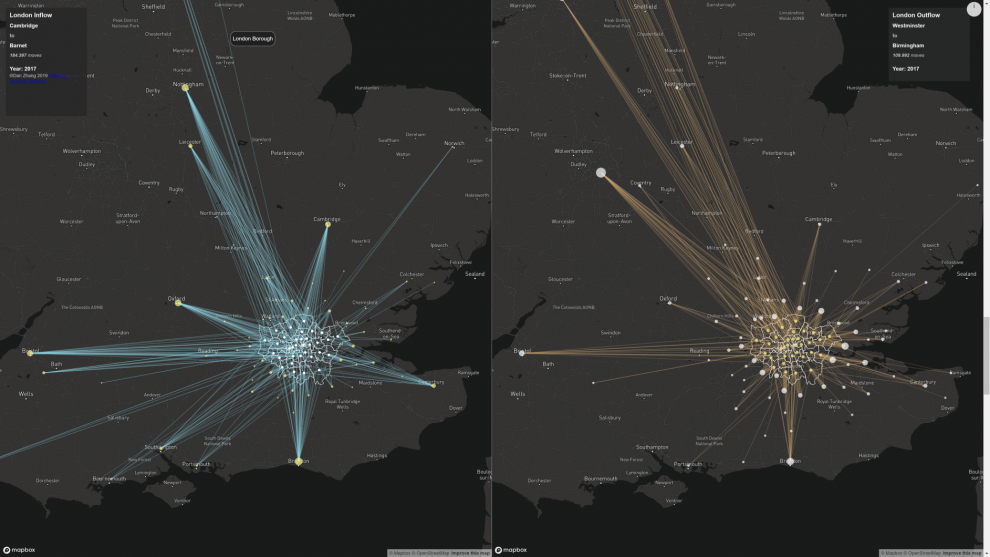
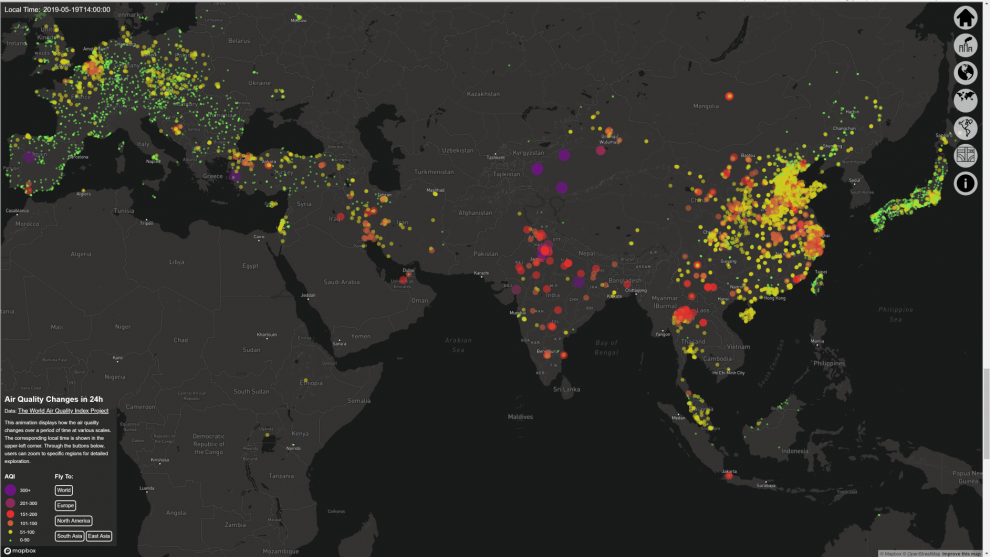
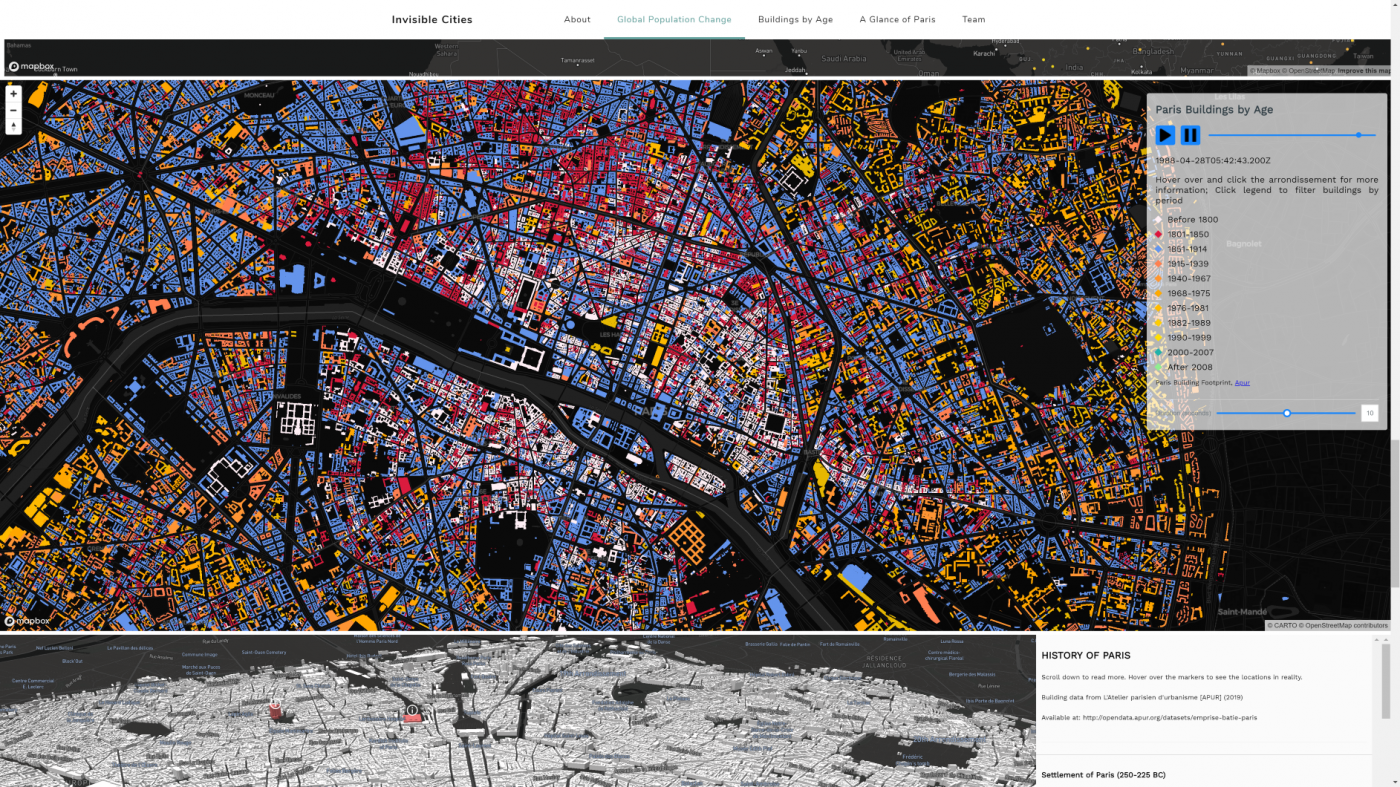
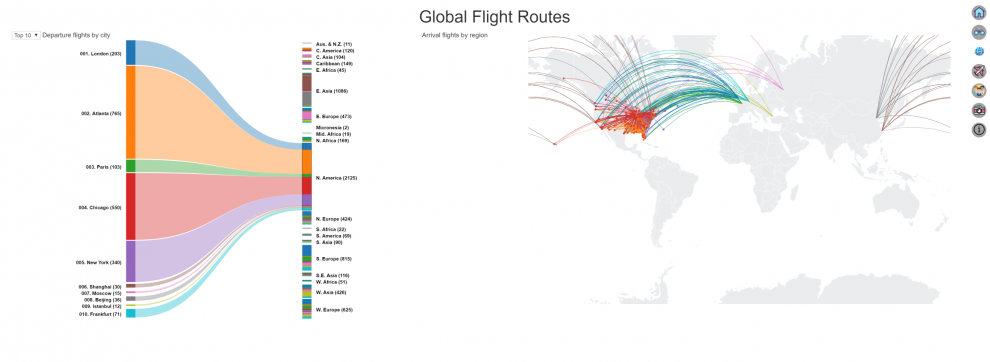
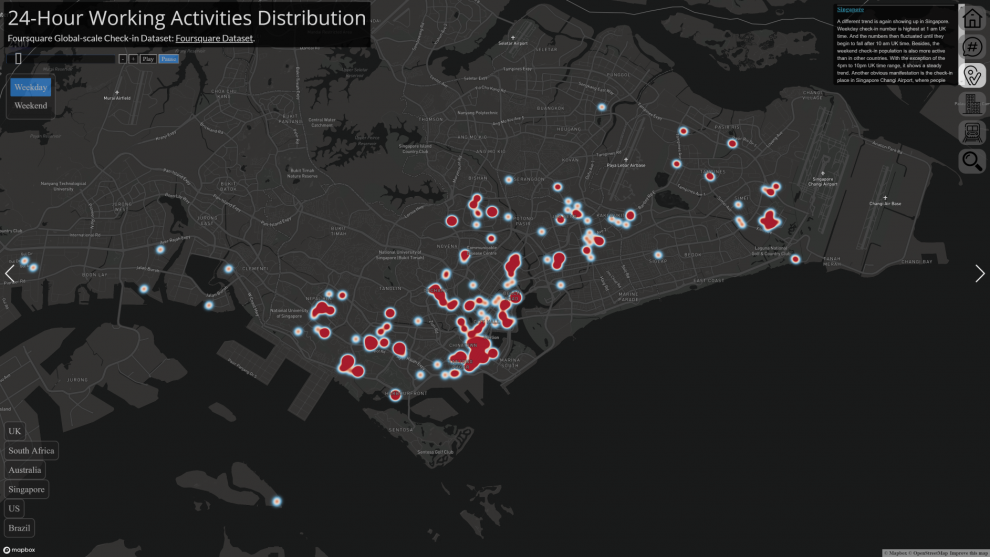
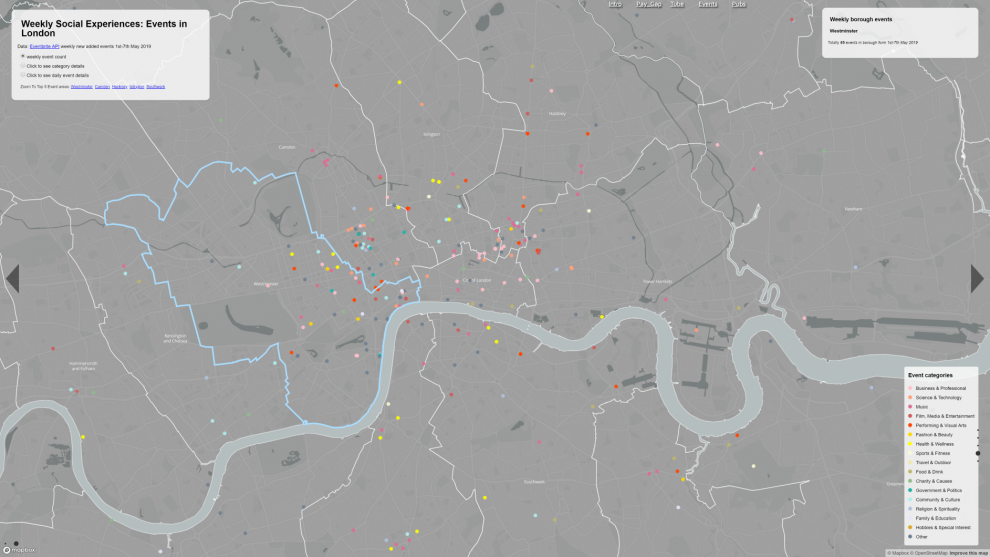
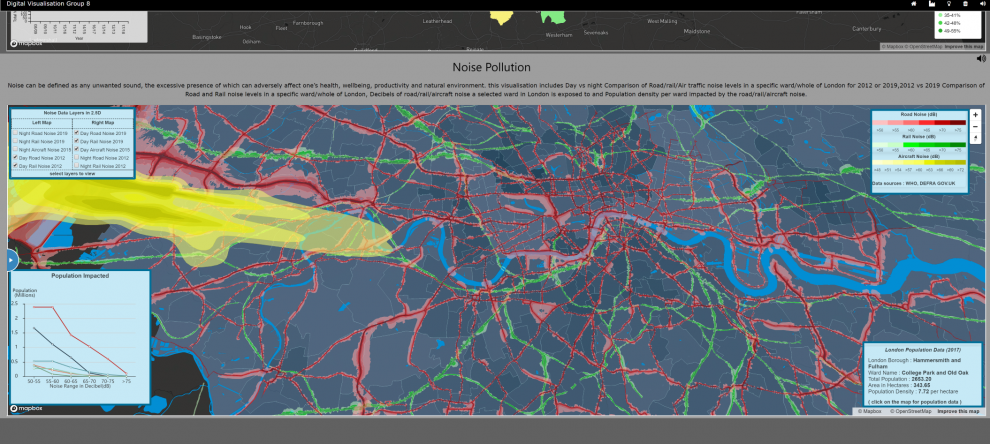
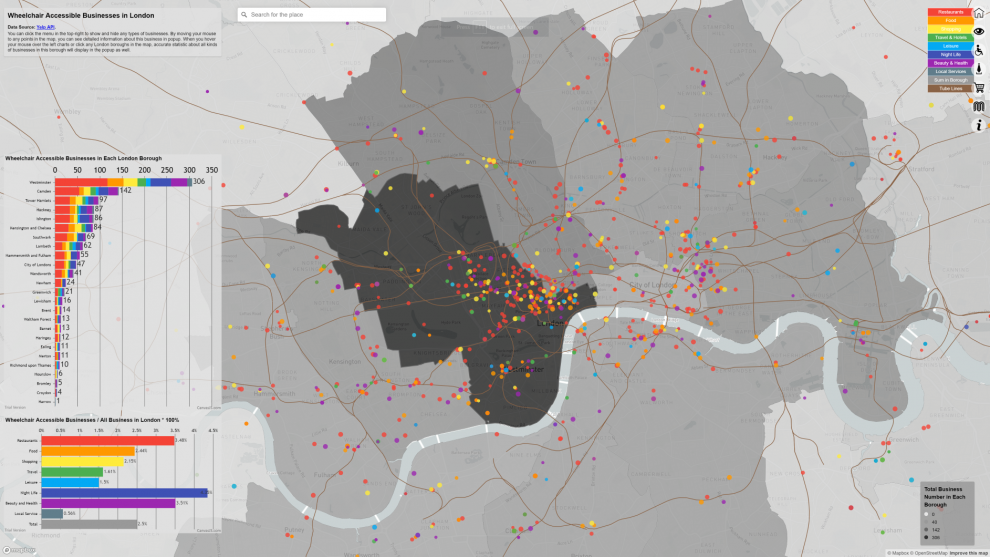
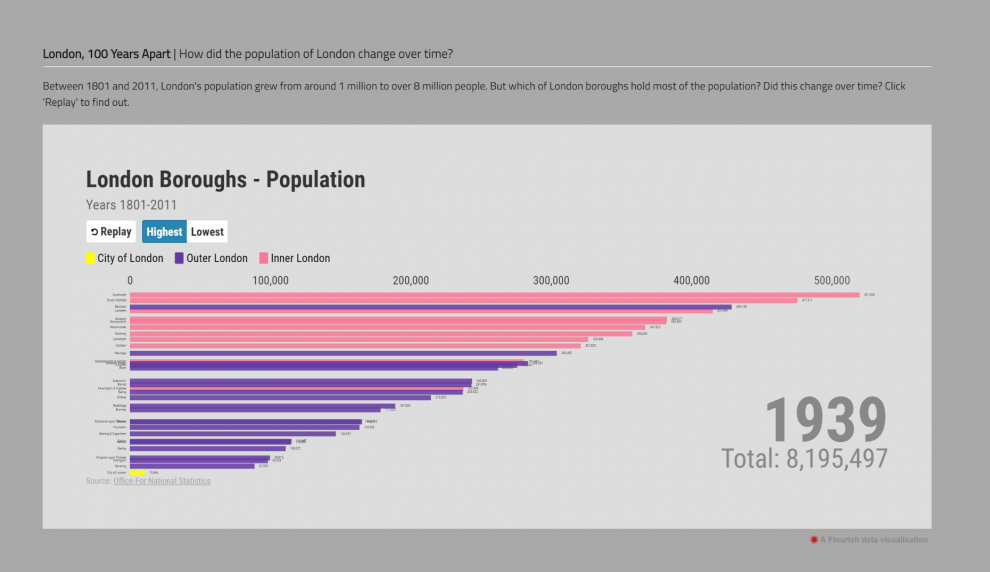
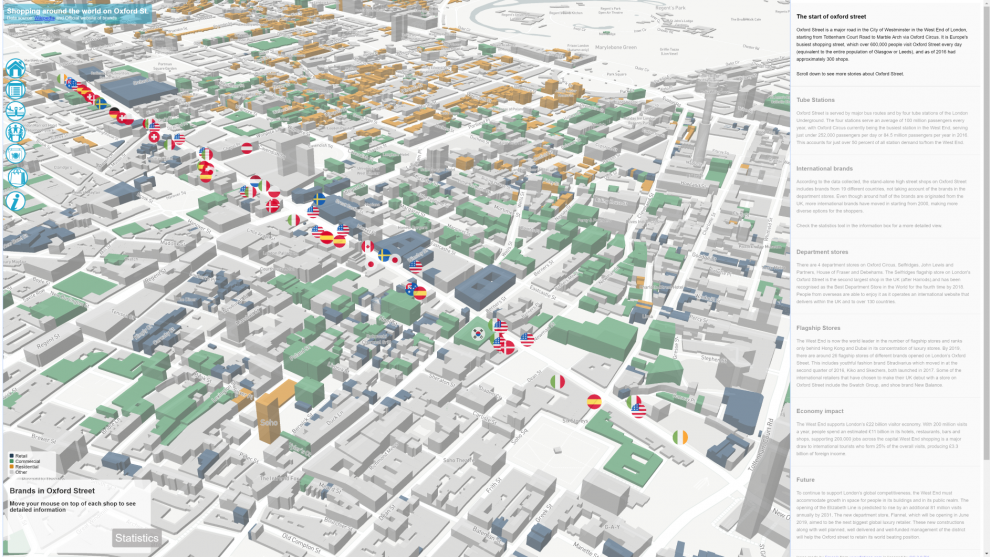
This year’s projects were on the theme of ‘Invisible Cities’ and students successfully experimented with a wide range of interactive mapping, animation and charting techniques exploring topics such as air quality, tourism, trade flows and working cultures.
There was a lot of very high quality visualisation work completed, including flow maps, animated time series visualisations, interactive charts and 2.5D building visualisations. Students were encouraged to use web-based technologies to enable outputs to be shared easily. The visualisation projects are all online and can be explored below.