CASA Working Paper 195

6 January 2014
Scale, Power Laws and Rank Size in Spatial Analysis
This chapter introduces a class of spatial probability distributions which depart from the normal distribution which is the baseline for conventional statistics and the point of departure for spatial analysis. The distributions we explore are skewed, their tails are heavy or fat rather than thin, and they often manifest extreme skews to the right or left or both. They consist of many objects which are small and few which are big, and their genesis is through processes of competition that sort these objects into distributions that can be approximated by power laws.
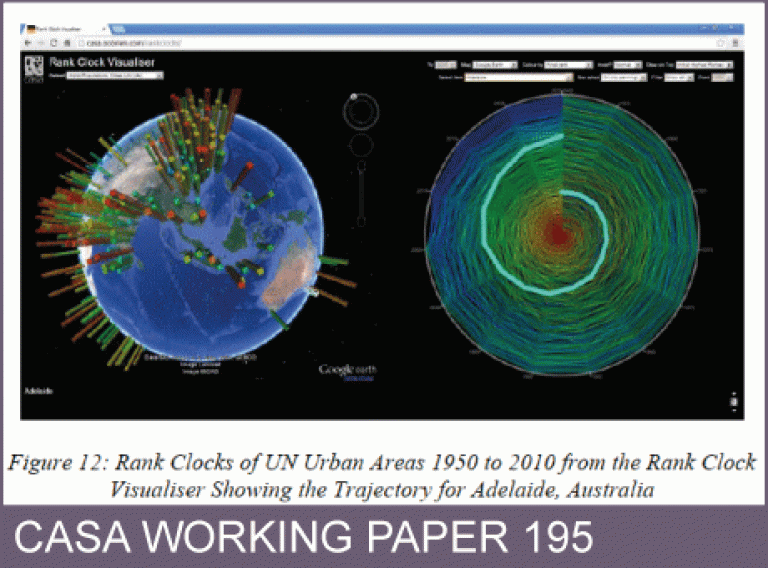
City size distributions are the classic exemplars and we illustrate these using cities in the US urban system whose distributions show dramatic aggregate regularities from decade to decade. However when we examine the constituents of these distributions – individual cities – these move up and down the distributions very rapidly showing equally dramatic volatility. This is a puzzle that has yet to be explained – why aggregate distributions are so stable but their components are so variable. Here we illustrate these ideas by visualising such movements using various mnemonics such as the rank plot, the rank clock, and temporal statistics related to the half lives of the objects that compose these ranks. We conclude by visualising these distributions and their dynamics with respect to their spatial locations.
Authors: Michael Batty
Publication Date: 6th January 2014
RPS ID:
Download Working Paper 195. File size 2.5MB, PDF format.
 Close
Close

