CASA Working Paper 152

1 January 2010
Visualising Space-Time Dynamics in Scaling Systems
The signature of scaling in human systems is the well-known power law whose key characteristic is that the size distributions of the elements or objects that comprise such systems, display self-similarity in space and time. In fact, in many of the systems such as cities, firms, and high buildings which we use as examples, power laws represent an approximation to the fat or heavy tails of their rank-size distributions, appearing to be stable in time showing little sign of changes in their scaling over tens or even hundreds of years. However when we examine the detailed dynamics of how their ranks shift in time, there is considerable volatility with the objects in such distributions not often persisting for longer than about 50-100 years.
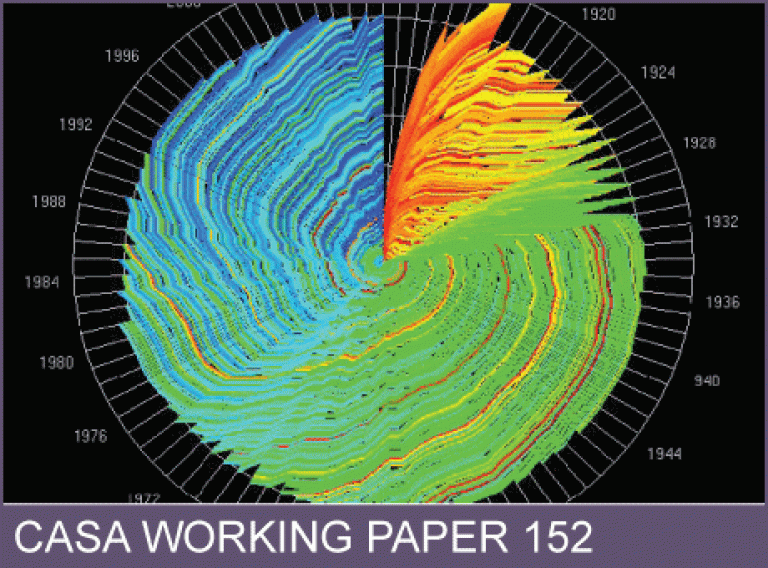
To explore this kind of micro-volatility, we introduce a number of measures of rank shift over space and time and visualise size distributions using the idea of the 'rank clock'. We use the example of changes in the populations of Italian towns between 1300 and 1861 to introduce these ideas and then compare this analysis with city-size distributions for the World from 430BCE, the US from 1790, the UK from 1901, and Israel from 1950. The morphologies of growth and change displayed by these clocks are all quite different. When we compare these to the distribution of US firms from 1955 in the Fortune 500 and to the distribution of high buildings in New York City and the World from 1909, we generate a panoply of different visual morphologies and statistics. This provides us with a rich portfolio of space-time dynamics that adds to our understanding of how different systems can display stability and regularity at the macro level with a very different dynamics at the micro.
This working paper is available as a PDF. The file size is 1.87MB.
Authors: Michael Batty
Publication Date: 1/1/2010
 Close
Close

