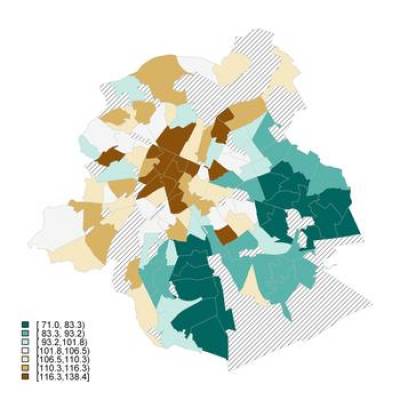
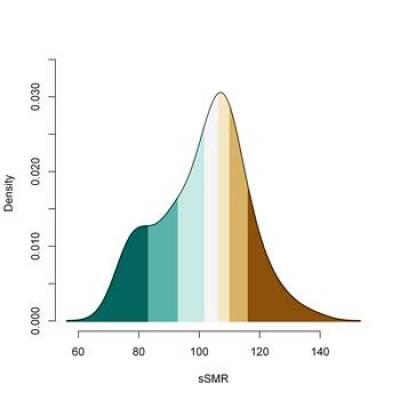
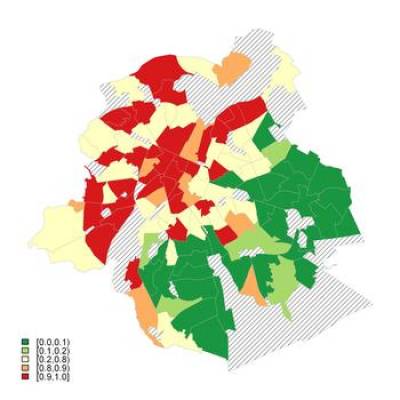
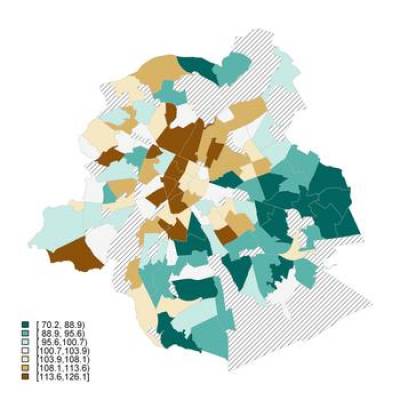
In the Brussels region, there were 32,743 deaths from all causes over the study period (2001 - 2004). This figure consists of 14,737 male deaths and 18,006 female deaths and is based on death certificate records linked to Census data.
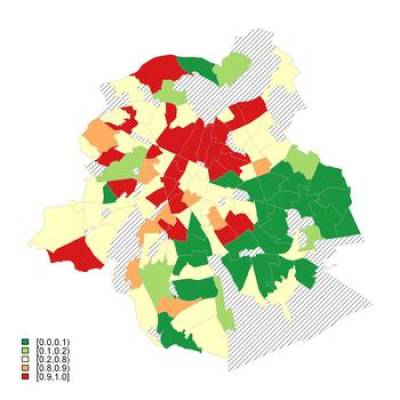
There is a clear divide in mortality risk within the Brussels region. Neighbourhoods with excess mortality are located in the North-Western half of the city, and are particularly clustered in the municipalities of Saint Josse Ten Noode and Molenbeek Saint Jean. However, there are areas of low mortality risk in the North-West, particularly evident in the map of female all-cause mortality. The South-Eastern areas of Brussels exhibit a consistent deficit in mortality risk, shown by the green tones on the map. Areas with a small number of inhabitants were excluded from the analysis, and are shown in stripes on the map.
For further information about how these maps were created, please visit the methodological section of the Atlas. Click on each image for a full-screen view of the maps below.
 Close
Close


