Close
Close

Data Completeness
| Completeness - 2018 | |
|---|---|
| N datasets | 34 |
| N oberservations | 11344 |
| age | 99.9% |
| sex | 100.0% |
| HIV status | 94.3% |
| Past treatment | 98.1% |
| Past TB type | 57.3% |
| Afb | 76.8% |
| Culture Conversion at month 6 | 70.8% |
| Outcome | 99.0% |
| Relapse | 3.9% |
| DSTLzd | 4.6% |
| DSTMfx | 9.5% |
| DSTLfx | 7.1% |
| DSTOfx | 64.9% |
| DSTCfx | 30.9% |
Original Data Curator: Dr. Dick Menzies, McGill University, Canada
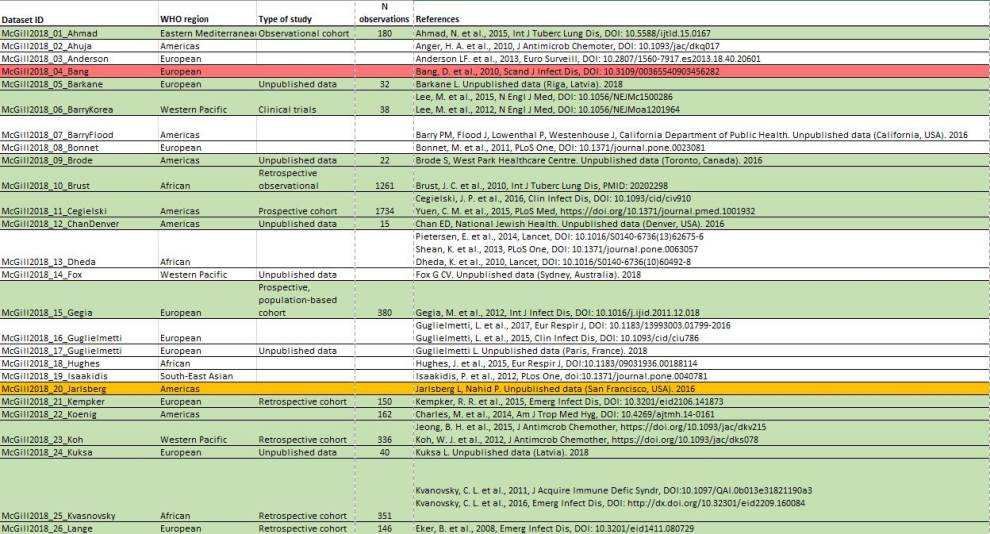
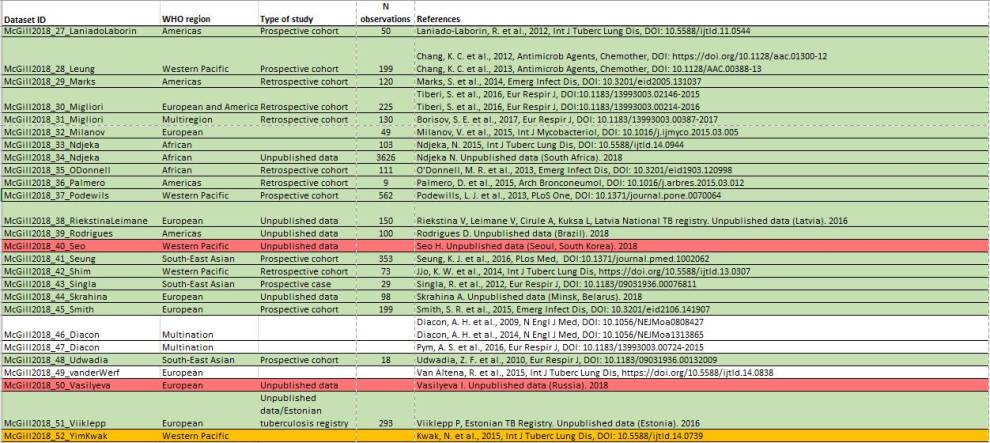
Individual Datasets
| Author | Overall | Ahmad | LatviaDIm 2018 (Barkane) | BARRY-KOREA | Brode | Brust | Cegielski | CHAN-DENVER | Gegia |
|---|---|---|---|---|---|---|---|---|---|
| WHO Region | Eastern Mediterranean | European | Western Pacific | Americas | African | Multiregion | Americas | European | |
| Type of Study | Observational cohort |
| Clinical trials | Unpublished data | Retrospective observational | Prospective cohort | Unpublished data | Prospective, population-based cohort | |
| N observations | 11344 | 180 | 32 | 38 | 22 | 1261 | 1734 | 15 | 380 |
| Age ≥ 18 years | 97.2% | 83.9% | 93.8% | 100.0% | 100.0% | 94.8% | 100.0% | 100.0% | 97.9% |
| Sex, male | 60.6% | 45.6% | 78.1% | 71.1% | 40.9% | 61.1% | 63.7% | 53.3% | 71.3% |
| HIV positive | 32.8% | - | 18.8% | - | - | 29.6% | 18.0% | - | 1.3% |
| Recieved previous TB treatment | 69.5% | 90.0% | 78.1% | 100.0% | 31.8% | 79.3% | 83.4% | 66.7% | 87.9% |
| Previous treatment: FLD | 43.3% | 81.7% | 9.4% | - | 31.8% | - | 69.8% | 46.7% | 66.6% |
| Previous treatment: SLD | 14.0% | 8.3% | 68.8% | 100.0% | - | - | 13.6% | 13.3% | 21.3% |
| AFB positive | 54.9% | 90.6% | 43.8% | 100.0% | 27.3% | - | 80.6% | - | - |
| Culture converted before month 6 | 61.4% | 82.2% | 90.6% | 81.6% | 95.5% | - | 74.5% | 80.0% | - |
| Outcome: complete | 8.1% | - | - | - | 77.3% | - | 5.7% | - | 12.6% |
| Outcome: cure | 46.5% | 74.4% | 81.2% | 78.9% | - | - | 53.2% | 66.7% | 40.3% |
| Outcome: death | 15.9% | 19.4% | 3.1% | - | 4.5% | 17.7% | 14.6% | 6.7% | 15.5% |
| Outcome: fail | 7.6% | 4.4% | - | 10.5% | 4.5% | 16.5% | 6.3% | - | 9.7% |
| Outcome: lost | 15.6% | 1.7% | 15.6% | 10.5% | - | 20.0% | 18.5% | - | 21.8% |
| Outcome: success | 4.6% | - | - | - | - | 41.7% | - | - | - |
| Outcome: transfer | 0.7% | - | - | - | 13.6% | - | 1.8% | - | - |
| DSTLzd resistant | 0.1% | - | - | - | - | - | - | - | - |
| DSTMfx resistant | 3.5% | - | 21.9% | 86.8% | 9.1% | - | 1.2% | 6.7% | - |
| DSTLfx resistant | 1.6% | - | 40.6% | 26.3% | - | - | - | 13.3% | - |
| DSTOfx resistant | 19.9% | 54.4% | 50.0% | 100.0% | 13.6% | 1.0% | 11.2% | 20.0% | 22.1% |
| DSTCfx resistant | 5.4% | - | - | - | - | 0.8% | 9.6% | 13.3% | - |
| Author | Kempker | Koenig-Pape | Koh | Latvia 2018 (Kuksa) | Kvasnovsky | Lange | Lanido-Laborin | LEUNG 2012/2013 | Marks |
|---|---|---|---|---|---|---|---|---|---|
| WHO Region | European | Americas | Western Pacific | European | African | European | Americas | Western Pacific | Americas |
| Type of Study | Retrospective cohort |
| Retrospective cohort |
| Retrospective cohort | Retrospective cohort | Prospective cohort | Prospective cohort | Retrospective cohort |
| N observations | 150 | 162 | 336 | 40 | 351 | 146 | 50 | 199 | 120 |
| Age ≥ 18 years | 100.0% | 94.4% | 99.1% | 100.0% | 98.6% | 96.6% | 98.0% | 99.5% | 97.5% |
| Sex, male | 72.7% | 51.2% | 53.6% | 72.5% | 45.3% | 76.0% | 64.0% | 74.4% | 50.0% |
| HIV positive | 4.0% | 20.4% | - | 17.5% | 62.1% | 2.7% | - | 1.5% | 10.8% |
| Recieved previous TB treatment | 44.7% | 98.1% | 86.9% | 42.5% | 96.0% | 55.5% | 100.0% | 54.8% | 35.8% |
| Previous treatment: FLD | 36.7% | 98.1% | 42.3% | 32.5% | 36.8% | 41.8% | - | 38.7% | - |
| Previous treatment: SLD | 8.0% | - | 44.6% | 10.0% | 59.3% | 10.3% | - | 16.1% | - |
| AFB positive | 96.0% | 100.0% | 62.2% | 57.5% | 50.1% | 62.3% | 100.0% | 74.4% | 78.3% |
| Culture converted before month 6 | 79.3% | 91.4% | 75.0% | 90.0% | 16.8% | 80.1% | 56.0% | 80.4% | 65.0% |
| Outcome: complete | 28.7% | - | 5.7% | - | 3.7% | 3.4% | - | 4.0% | 76.7% |
| Outcome: cure | 27.3% | 78.4% | 75.3% | 77.5% | 6.0% | 67.1% | 78.0% | 64.8% | - |
| Outcome: death | 7.3% | 14.2% | 1.5% | 7.5% | 62.1% | 8.9% | - | 3.5% | 9.2% |
| Outcome: fail | 4.0% | 1.2% | 4.5% | - | 17.4% | - | 2.0% | 8.5% | 1.7% |
| Outcome: lost | 32.0% | 6.2% | 6.5% | 15.0% | 6.8% | 12.3% | 14.0% | 16.1% | 2.5% |
| Outcome: success | - | - | - | - | - | - | - | - | - |
| Outcome: transfer | 0.7% | - | - | - | 0.3% | 8.2% | 6.0% | 3.0% | 10.0% |
| DSTLzd resistant | - | - | - | - | - | - | - | - | - |
| DSTMfx resistant | - | - | 27.1% | 17.5% | - | - | 6.0% | - | 2.5% |
| DSTLfx resistant | - | - | 13.1% | 12.5% | - | - | 2.0% | - | 4.2% |
| DSTOfx resistant | 12.0% | - | 42.9% | 22.5% | 64.4% | 8.9% | - | 21.1% | 7.5% |
| DSTCfx resistant | - | - | - | - | 35.6% | - | - | - | 7.5% |
| Author | Migliori | MiglioriBDQ | Milanov | Ndjeka | South Africa 2018 (Ndjeka) | ODonnell | PALMERO 2015 | Podewils | RIEKS 2012/13 |
|---|---|---|---|---|---|---|---|---|---|
| WHO Region | European and Americas | Multiregion | European | African | African | African | Americas | Western Pacific | European |
| Type of Study | Retrospective cohort | Retrospective cohort |
|
|
| Retrospective cohort | Retrospective study | Prospective cohort | Unpublished data |
| N observations | 225 | 130 | 49 | 103 | 3626 | 111 | 9 | 562 | 150 |
| Age ≥ 18 years | 96.0% | 98.5% | 100.0% | 100.0% | 95.8% | 100.0% | 100.0% | 98.4% | 100.0% |
| Sex, male | 54.7% | 65.4% | 71.4% | 45.6% | 56.8% | 42.3% | 55.6% | 61.0% | 76.7% |
| HIV positive | 4.0% | 7.7% | - | 63.1% | 68.8% | 71.2% | - | - | 22.0% |
| Recieved previous TB treatment | 60.9% | 86.9% | 63.3% | - | 52.6% | 80.2% | 100.0% | 97.9% | 31.3% |
| Previous treatment: FLD | - | 38.5% | - | - | 40.9% | - | 55.6% | 97.9% | 21.3% |
| Previous treatment: SLD | - | 45.4% | - | - | 11.7% | - | 44.4% | - | 10.0% |
| AFB positive | 80.0% | 70.8% | 63.3% | 35.0% | 67.3% | 60.4% | - | - | 54.0% |
| Culture converted before month 6 | 80.9% | 65.4% | - | - | 79.8% | 33.3% | 88.9% | 87.7% | 83.3% |
| Outcome: complete | 27.1% | 10.8% | 10.2% | 5.8% | 10.3% | 9.0% | - | 1.4% | 2.0% |
| Outcome: cure | 49.8% | 66.9% | 36.7% | 53.4% | 48.4% | 13.5% | 33.3% | 67.1% | 70.0% |
| Outcome: death | 10.7% | 6.2% | 38.8% | 17.5% | 17.7% | 44.1% | 33.3% | 12.6% | 10.0% |
| Outcome: fail | 0.4% | 12.3% | 12.2% | 1.0% | 5.1% | 18.9% | 11.1% | 3.7% | 3.3% |
| Outcome: lost | 9.8% | 3.8% | 2.0% | 4.9% | 18.5% | 14.4% | 22.2% | 15.1% | 14.0% |
| Outcome: success | - | - | - | - | - | - | - | - | - |
| Outcome: transfer | 2.2% | - | - | 1.0% | - | - | - | - | 0.7% |
| DSTLzd resistant | 2.2% | 1.5% | - | - | - | - | 11.1% | - | - |
| DSTMfx resistant | - | - | - | 9.7% | 3.5% | - | 11.1% | - | - |
| DSTLfx resistant | - | - | - | - | 0.1% | - | 22.2% | 9.8% | - |
| DSTOfx resistant | 39.1% | 74.6% | 24.5% | 71.8% | 17.8% | 2.7% | 66.7% | 10.7% | 18.7% |
| DSTCfx resistant | - | - | - | - | - | 98.2% | - | 35.1% | - |
| Author | Brazil 2018 (Rodrigues) | Seung | Shim | Singla | Belarus 2018 (Skrahina) | Smith | Udwadia | Viiklepp |
|---|---|---|---|---|---|---|---|---|
| WHO Region | Americas | South-East Asian | Western Pacific | South-East Asian | European | European | South-East Asian | European |
| Type of Study | Unpublished data | Prospective cohort | Retrospective cohort | Prospective case series | Unpublished data | Prospective cohort | Prospective cohort | Unpublished data/ Estonian tuberculosis registry |
| N observations | 100 | 353 | 73 | 29 | 98 | 199 | 18 | 293 |
| Age ≥ 18 years | 97.0% | 100.0% | 98.6% | 86.2% | 98.0% | 100.0% | 100.0% | 99.3% |
| Sex, male | 59.0% | 63.2% | 63.0% | 44.8% | 72.4% | 84.9% | 72.2% | 70.3% |
| HIV positive | 8.0% | - | - | - | 3.1% | - | - | 11.9% |
| Recieved previous TB treatment | 97.0% | 87.3% | 80.8% | 100.0% | 79.6% | 70.4% | 100.0% | 31.1% |
| Previous treatment: FLD | 71.0% | 87.3% | 23.3% | 65.5% | 10.2% | 34.2% | - | 12.6% |
| Previous treatment: SLD | 25.0% | - | 53.4% | 34.5% | 53.1% | 36.2% | 100.0% | 18.4% |
| AFB positive | 91.0% | - | 83.6% | 100.0% | 41.8% | 81.4% | 100.0% | 60.4% |
| Culture converted before month 6 | 74.0% | - | 47.9% | 89.7% | 100.0% | 80.4% | - | 75.4% |
| Outcome: complete | 28.0% | 5.7% | 6.8% | 100.0% | 100.0% | 100.0% | 100.0% | 100.0% |
| Outcome: cure | 54.0% | 65.2% | 50.7% | 13.8% | 18.4% | 1.0% | - | 6.1% |
| Outcome: death | 5.0% | 10.2% | 1.4% | 55.2% | 77.6% | 56.3% | 66.7% | 67.6% |
| Outcome: fail | 3.0% | 17.6% | 32.9% | 10.3% | - | 10.6% | 5.6% | 8.2% |
| Outcome: lost | 10.0% | 1.4% | 5.5% | 6.9% | 3.1% | 11.1% | - | 6.8% |
| Outcome: success | - | - | - | 13.8% | 1.0% | 21.1% | 27.8% | 10.9% |
| Outcome: transfer | - | - | - | - | - | - | - | - |
| DSTLzd resistant | - | - | - | - | - | - | - | 0.3% |
| DSTMfx resistant | - | - | 69.9% | - | - | - | - | 0.3% |
| DSTLfx resistant | 1.0% | - | - | - | 34.7% | - | - | 1.4% |
| DSTOfx resistant | 14.0% | 12.2% | 98.6% | - | 34.7% | - | - | - |
| DSTCfx resistant | - | - | - | 100.0% | 91.8% | 5.5% | 55.6% | 22.9% |
*percentages relative to total number of observations per dataset.
Original Data Curator: Dr. Dick Menzies, McGill University, Canada.
Datasets
Please note there is a traffic light system for the datasets.
Green: Available
Yellow: In process
Red: Unavailable
White: In negotiation