 Close
Close

Students create spatial visualisations using energy, transportation and climate change data
4 March 2022
UCL Energy Institute students responded to a spatial data visualisation challenge as part of the Spatial Analysis of Energy Data module.
Students on the Energy Systems and Data Analytics (ESDA) MSc used the challenge as an opportunity to use diverse sets of geospatial data related to energy, transportation and climate change from across the globe to create a range of map visualisations on topics from Optimisation of EV chargers, Geothermal and Hydropower potential, to Global Warming challenges and fuel poverty. The challenge asked the students to communicate complex spatial dynamics around the energy systems with a map minimising the use of text. This required the students to be empathic with the potential map users, synthesise data to key useful information and develop supportive aesthetics.
Here we present the top five maps submitted for the 21/22 cohort with commentary by the authors giving context to the rationale of each map. The whole range of maps created by the third ESDA cohort are available to view online.
Potential Investment Area for Wind and Solar Plants in Line with California’s Mandate to Sell Only Zero-Emission Vehicles in 2035
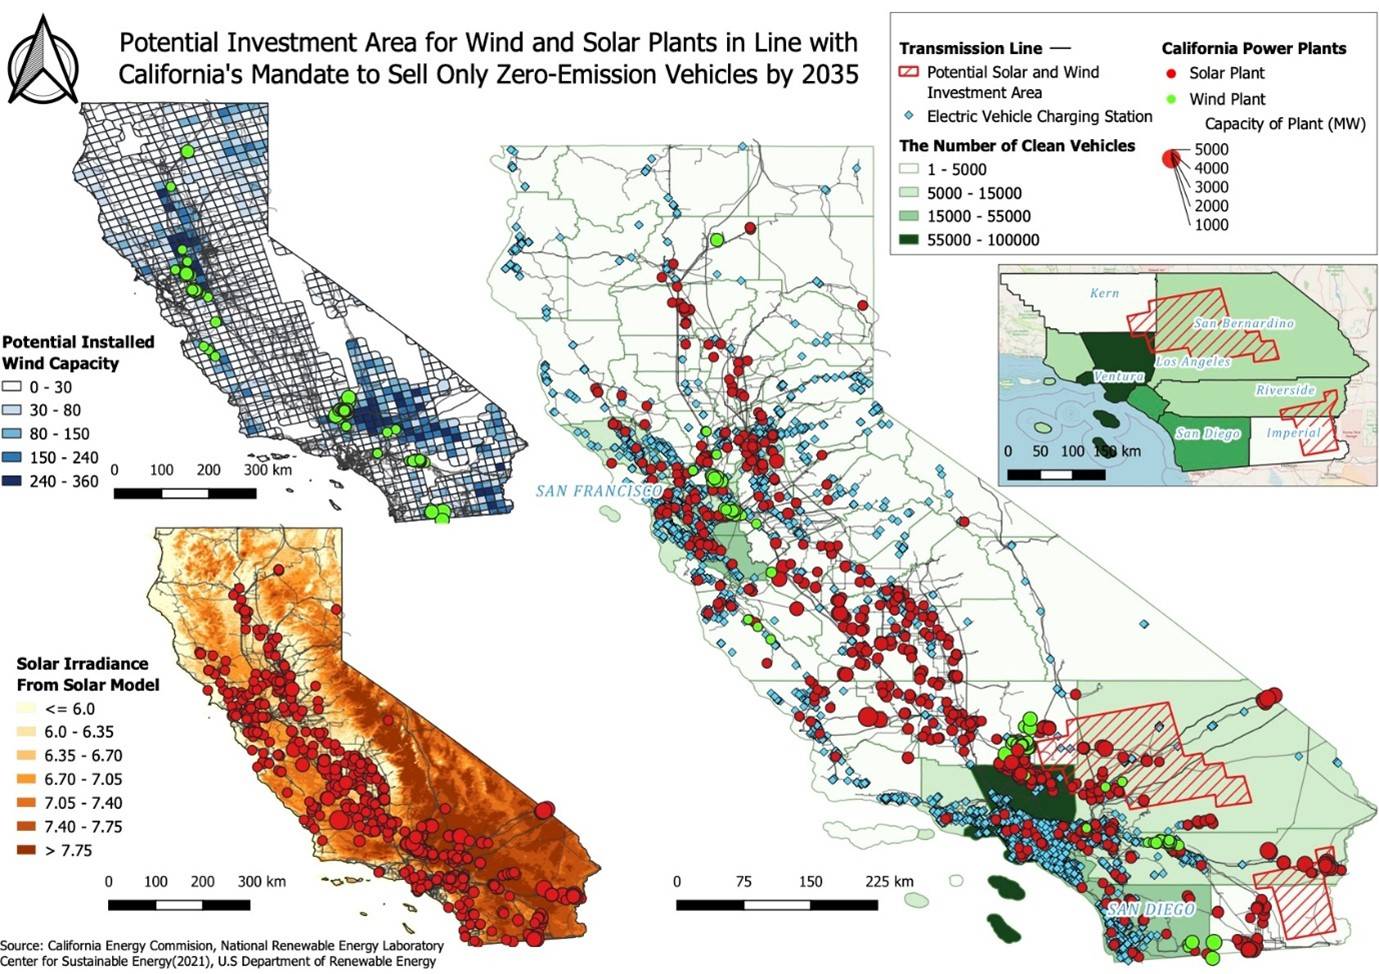
The biggest challenge of the project is to find potential investment areas for solar and wind plants. When I pick the investment area, I have to consider not only wind and solar potential but also land cover and protected area. Due to the time constraints, I wasn’t able to analyse other spatial constraints, such as topographic inclination and distance from residential areas.
Created by Jiahao Shi
Reuse of Oil and Gas Assets for CCUS projects in the UK
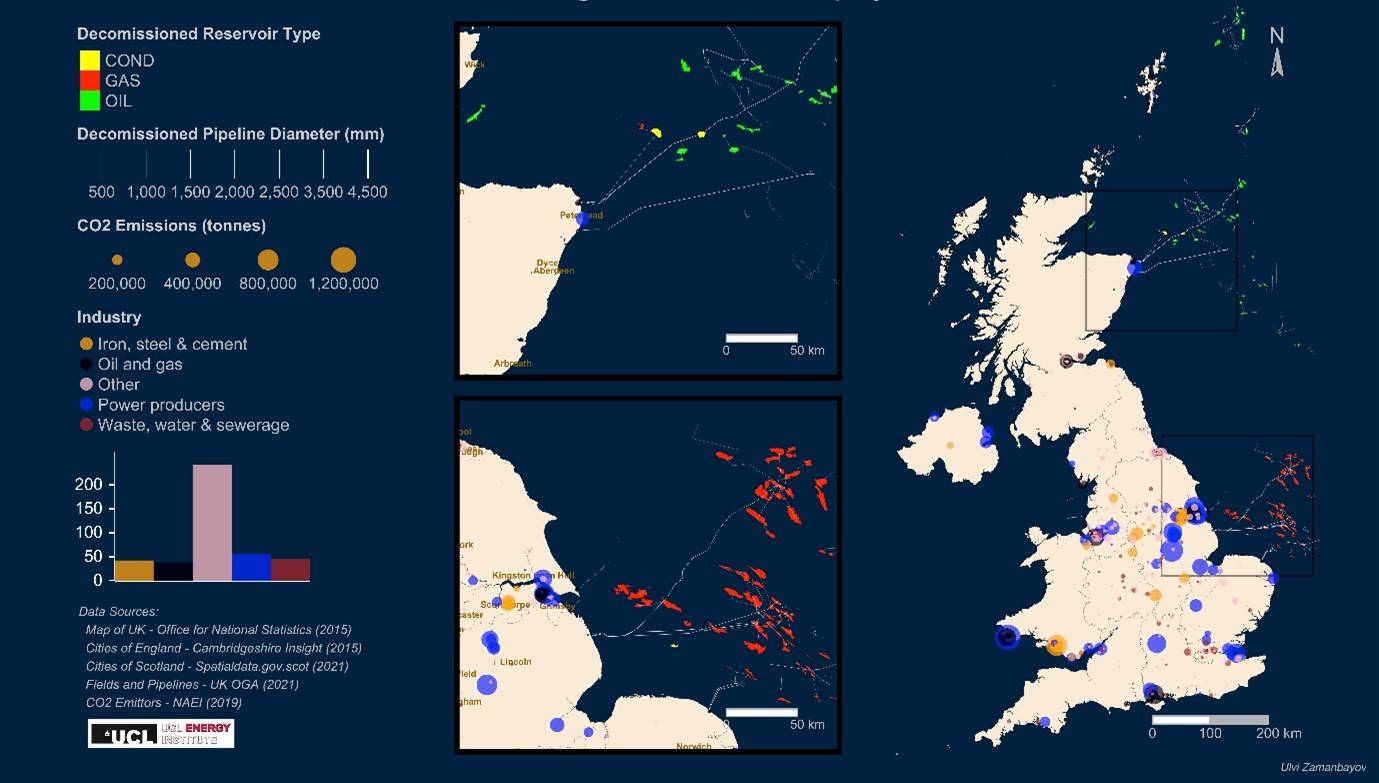
With this map, I attempted to convey how well placed the UK is for CCUS deployment due to the existing oil and gas infrastructure. Particularly, the map shows decommissioned pipelines that can be employed for transporting the CO2 into the offshore and the depleted hydrocarbon fields that are already well studied and would provide enough storage to last the UK for 100s of years, as well as heavy emitters that are clustered in a few convenient locations.
Reuse of this infrastructure could lead to significant time and cost savings in CCUS deployment, making it a more attractive solution.
The two zoomed-in sections show areas with an abundance of heavy emitters in close proximity to the decommissioned infrastructure. As a matter of fact, they show the Acorn cluster in Scotland and the East Coast Cluster in England, which are two of the three clusters prioritised for CCUS deployment by the UK government.
The biggest challenge I faced making this map was finding good and relevant data, something I think every data-related project struggles with. This is especially the case for the relatively conservative oil and gas industry.
It would be beneficial to add the ages of pipelines to assess if they require maintenance, as well as more information on the depleted fields, such as the estimated capacities.
Created by Ulvi Zamanbayov
The Energy Challenge for Earthquake-Prone Tokyo
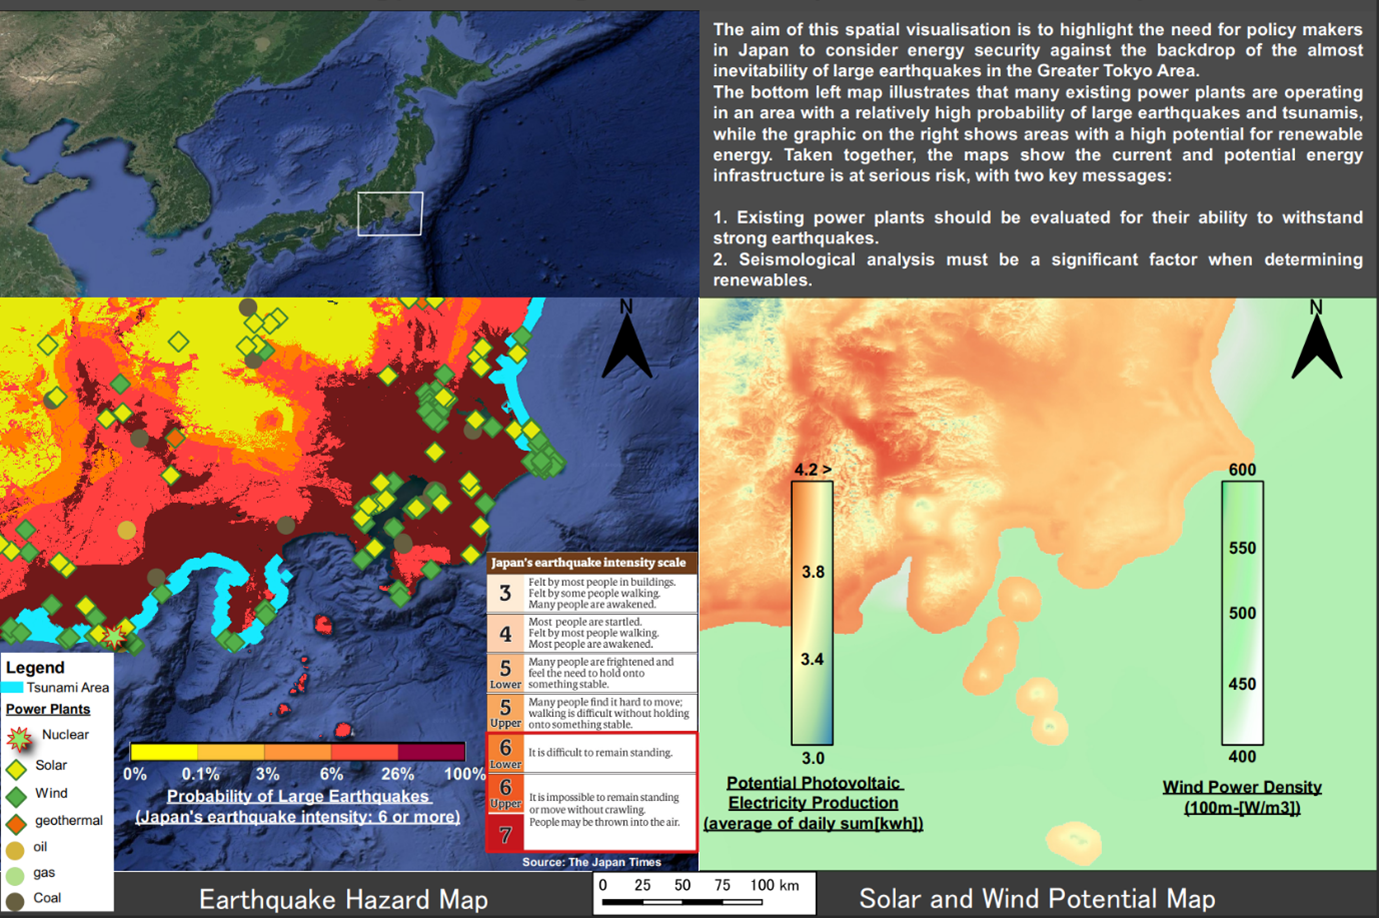
The bottom left map illustrates that many existing power plants are operating in an area with a relatively high probability of large earthquakes and tsunamis, while the graphic on the right shows areas with a high potential for renewable energy. Taken together, the maps show the current and potential energy infrastructure is at serious risk, with two key messages:
- Existing power plants should be evaluated for their ability to withstand strong earthquakes.
- The seismological analysis must be a significant factor when determining renewables.
Created by Masa Aoki
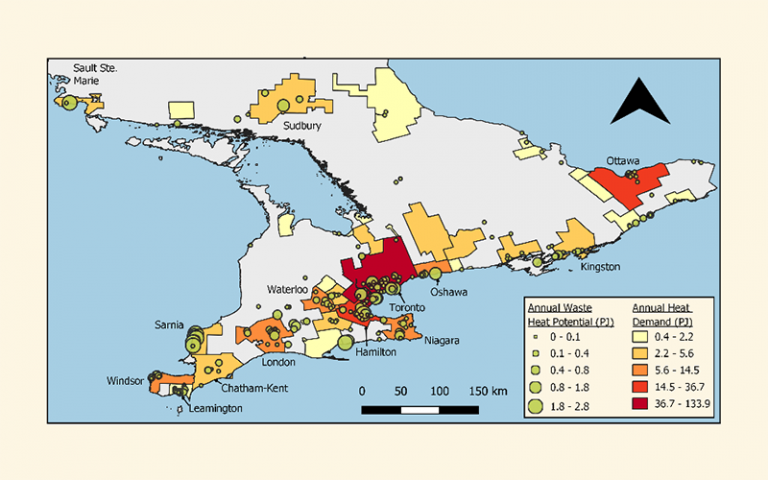
Industrial Waste Heat Recovery Potential and Metropolitan Heating Demand in Ontario
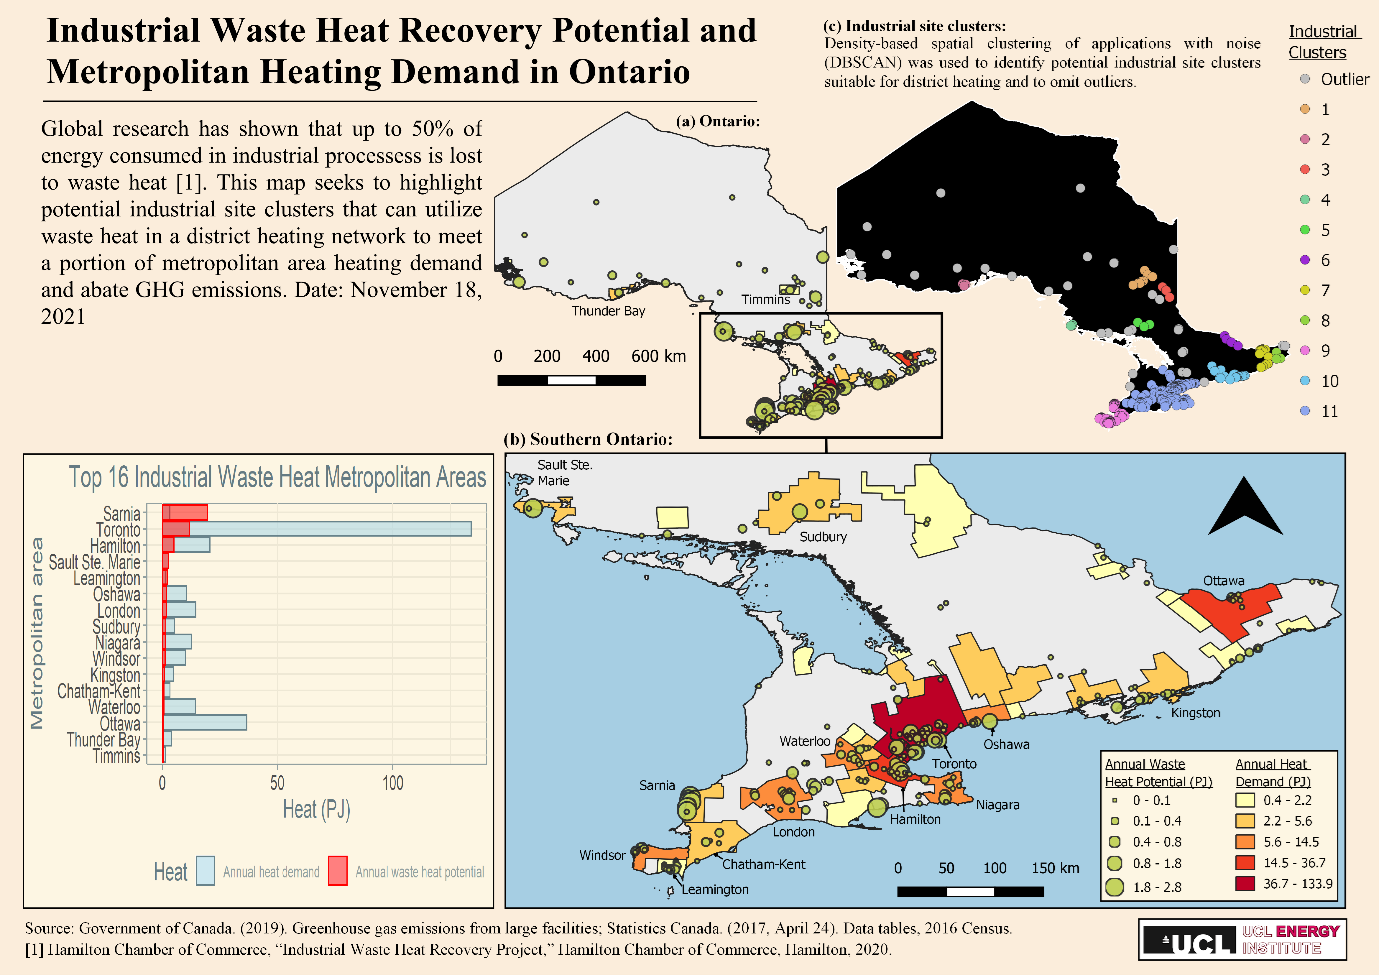
Using common methods from the literature and making reasonable assumptions within the scope and time constraint of the coursework, it was possible to make estimates and validate them with the literature.
Created by Christopher Lee
South Korea Solar Power Production and REC Price Trend
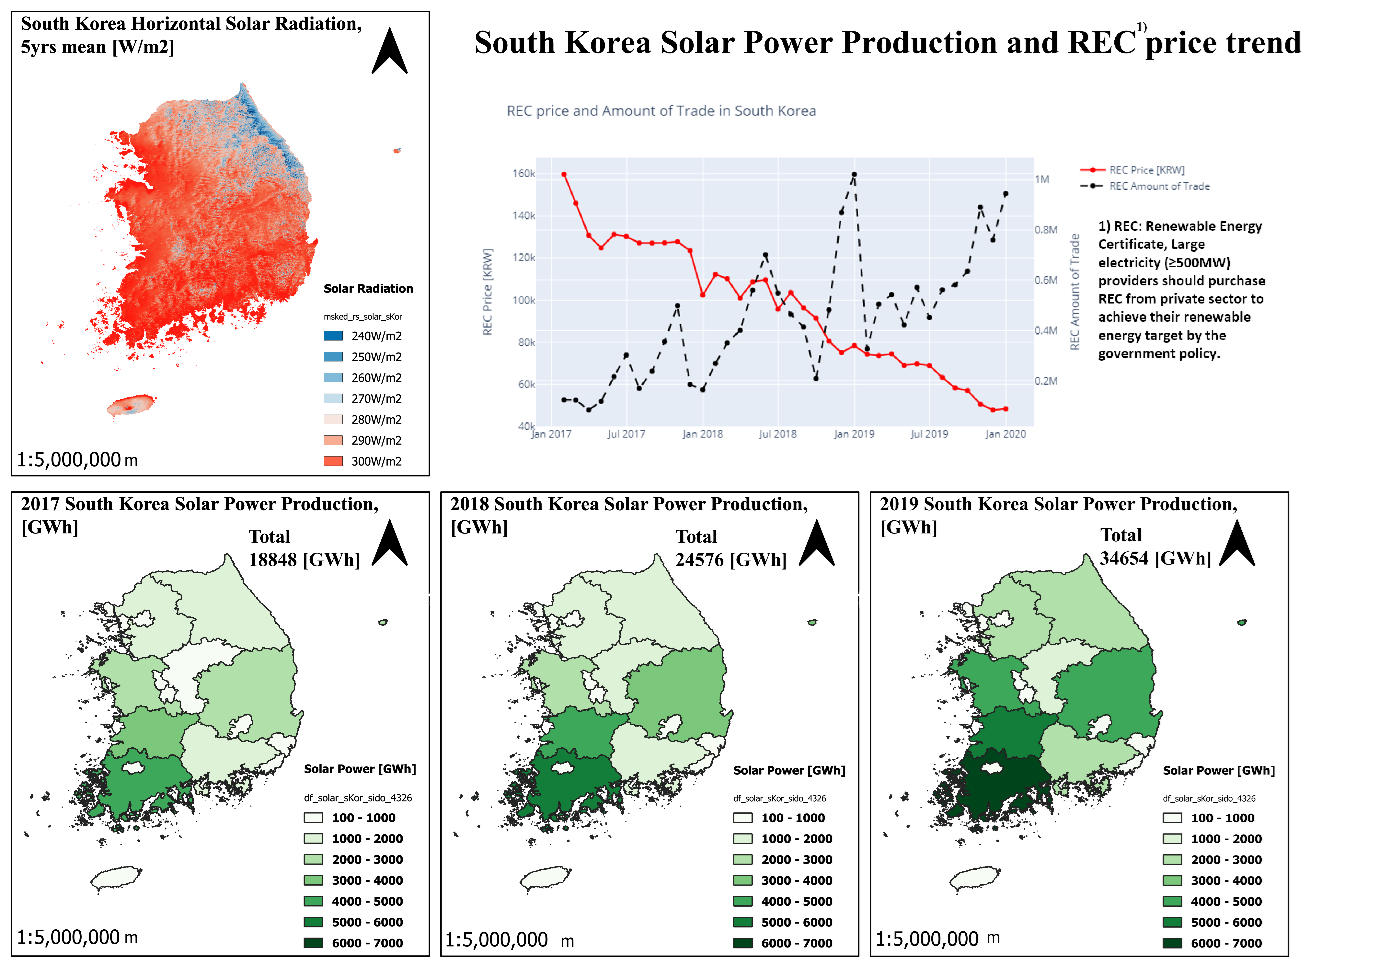
An objective of the map is to show spatial solar energy potential and actual solar energy production of South Korea from 2017 to 2019 and the REC market price trend. By showing them together, it is expected that policymakers will understand growing competition in the REC market and consider adjusting the imposing renewable energy percentage of the RPS to promote the renewable energy industry.
Created by Ho Sig Lee
Links: