 Close
Close

New approach developed by UCL opens opportunities for exploring specific shipping emission drivers
9 October 2018
In a recent paper, published in Journal of Cleaner Production, Schim van der Leoff, Godar & Prakash combine various data sets to estimate commodity and trade route specific shipping emissions.
The voyage- and commodity-specificity of the approach allows for specifying those commodities and trading routes which contribute the most towards the emissions in relation to those that are most valuable to a countries economy.
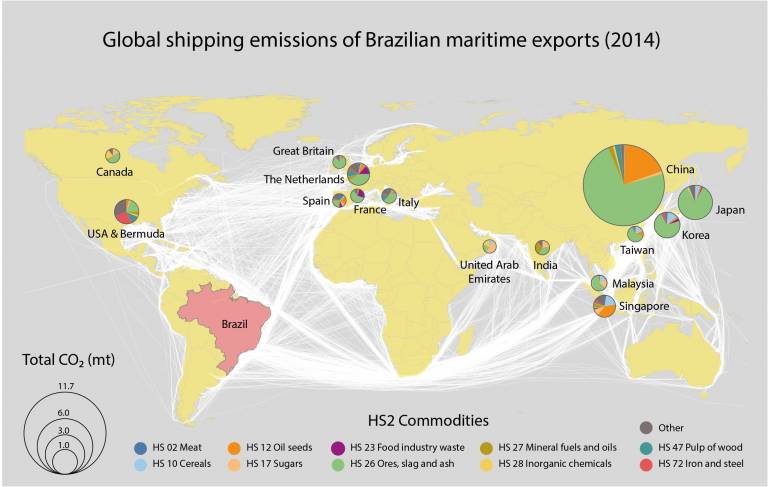
The authors, using Brazil as a case study, link per vessel cargo composition data derived from shipping manifest data and bill of lading, individual vessel journeys from the Automatic Identification System (AIS) and a bottom-up methodology from Third IMO GHG Study (2015) to estimate shipping emissions. The manifests used in the study included the shipment of 350,734 cargo-specific trades, shipped on 4,089 vessels, describing 124,173 voyages moving goods from Brazil to 112 countries. By matching the exported cargo composition with the appropriate sailed voyage, the study was able to obtain the spatially-explicit shipping emissions associated with the transportation of each traded commodity and arrival country.
In the case of Brazil, the study found that the maritime transportation associated with these trades is responsible for 25.99 million tonnes of CO2. To put this into perspective, this amounts to 5% of Brazil’s total CO2 emissions from 2014 (reported by the World Bank, currently excluding international shipping and aviation). Over 90% of Brazil’s maritime exports is made up of 8 key commodity groups and transported to 28 countries, which illustrates Brazil’s nature of being a major exporter of commodities in bulk of relatively low value, to major production countries and/or transhipment hubs. By analysing commodity- and voyage-specific emissions in conjunction, the above-described strong allocation to a very limited number of products and actors became evident.
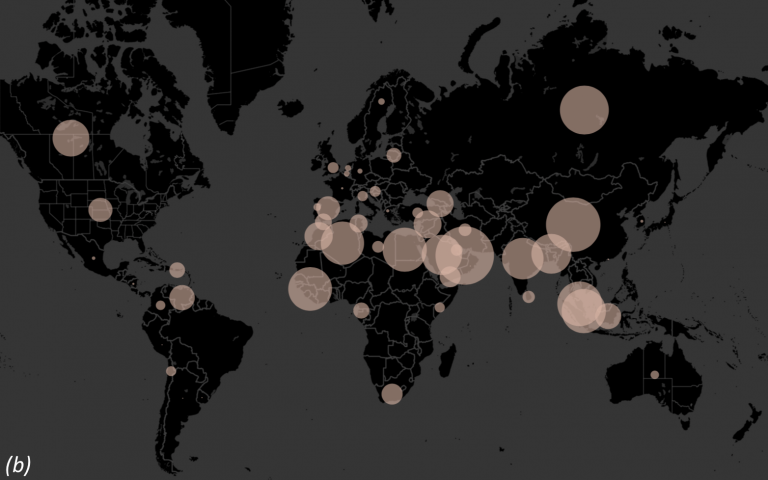
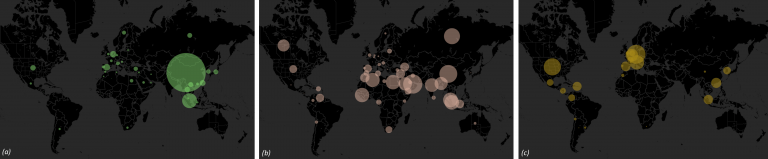
The new approach also allowed for an in depth focus on individual commodities. The figure below is an example of the way the results can highlight direct geographic demand. (a) shows how the vast majority of emissions associated to soybean transportation are linked to exports to China. Additionally, the method can show the geographic allocation of shipping emissions associated to some of the more valuable exported commodities, which may be of economic interest to the country in question, for example sugar and coffee, ranked 3rd and 7th in value, as shown in figures (b) and (c).
Links
- Read a summary of the paper
- Download the full paper: A spatially explicit data-driven approach to calculating commodity-specific shipping emissions per vessel