 Close
Close

UCL-Energy 'High-Rise Buildings: Energy and Density' research project results
13 June 2017

This EPSRC-funded project ran at the Energy Institute from December 2015 to April 2017. The research team included Philip Steadman, Ian Hamilton, Daniel Godoy-Shimizu, Homeira Shayesteh and Stephen Evans at UCL; Graciela Moreno at LDA Design; and Michael Donn at Victoria University Wellington (New Zealand).
The project set out to answer two questions:
Are high-rise buildings more energy-intensive – all other things being equal – than low-rise buildings?
Is it possible to provide the same floor area on the same site as high-rise buildings, but on a much-reduced number of storeys
The results show conclusively that the answer to both questions is ‘Yes’. It follows that much energy could be saved by discouraging tall buildings and encouraging low-rise in their place.
The work was divided into four parts.
1. An analysis of operational energy use in some 700 UK office buildings of varying height
2. A statistical analysis of operational energy use against height of all residential buildings, grouped at the level of neighbourhoods, in twelve London boroughs
Both these studies used actual electricity and gas meter records. (Embodied energy use was not considered.)
3. A study of the relationship of built form to density
4. An analysis of the possible physical causes of the observed increase of energy use with height, using computer simulation. This work continues.
- 1. Energy use and height in office buildings
Energy use and floor area data for the sample of office buildings come from three sources: Display Energy Certificates, the Better Buildings Partnership, and the London Mayor’s Energy Challenge. The buildings are all in the UK, the majority in London. They range in height from 2 storeys to more than 30 storeys. Some are air-conditioned, others mechanically or naturally ventilated. Some are commercial offices, others public. Their dates of construction range from pre-1900 to the present.
Further data have been matched to the sample from public sources including the Emporis skyscraper database, Valuation Office Agency rating records, and UCL’s 3DStock model, to provide crosschecks and extra information on built form including volume and surface area. Yet more data have been collected by hand for approximately a third of the sample on the materials and envelope of the buildings. Glazing ratio has been measured for 80 of the buildings.
Electrically heated buildings account for 15% of the sample. These are being studied separately and have been excluded from the analyses presented here. Figures 1, 2 and 3 give overall results for the remainder of the sample. They show mean annual electricity and fossil fuel use (kilowatt hours per square metre) and carbon emissions (kilograms of CO2 per square metre) against building height, the heights being aggregated into five bands. The fossil fuel is almost entirely gas. Consumption of both fuels has been weather-corrected to account for the buildings’ locations and the metered year.
Figure 1: Energy use (kWh/m2) and carbon emissions (kgCO2/m2) in 600 office buildings of differing heights. Blue = electricity; orange = fossil fuels; black = carbon emissions.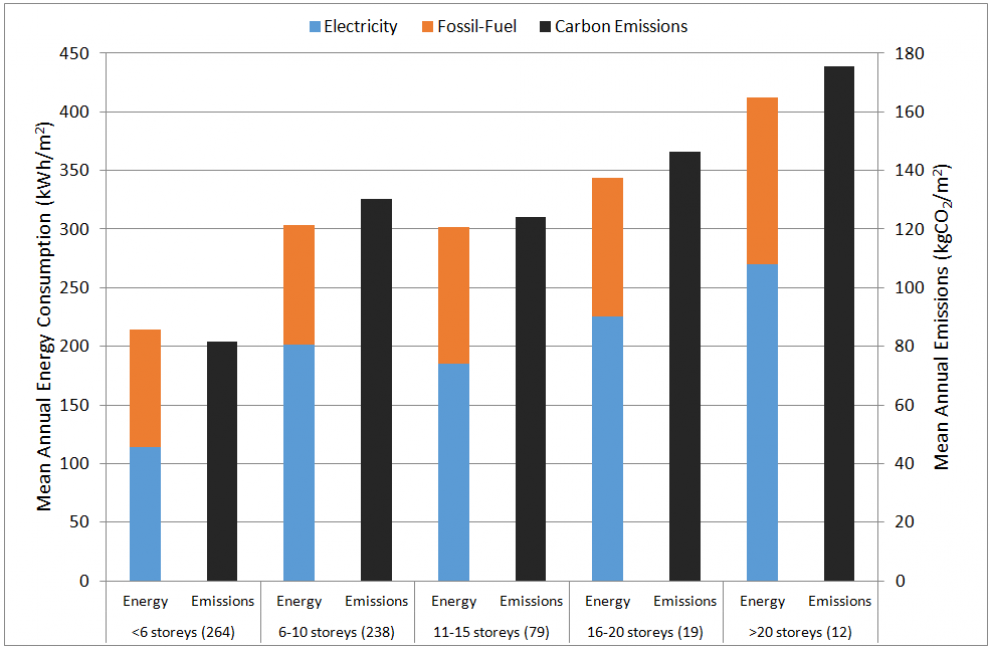
Figure 1 shows overall energy performance and carbon emissions, against height. Mean fossil fuel use is shown in orange, and mean electricity use in blue: the scale (kWh/m2) is at the left. Carbon emissions are shown in black: the scale (kg CO2/m2) is at the right. Comparing buildings on 6 storeys and fewer (‘low-rise’) with buildings on 20 storeys and more (‘high-rise’), electricity use in the high-rise is nearly two and a half times greater than in the low-rise (a 135% increase). The increase in fossil fuel use (by 40%) is less marked. Carbon emissions are more than doubled going from ‘low-rise’ to ‘high-rise’.
Figure 2: The results for energy use of Figure 1 divided between air-conditioned (left) and non-air-conditioned buildings (right)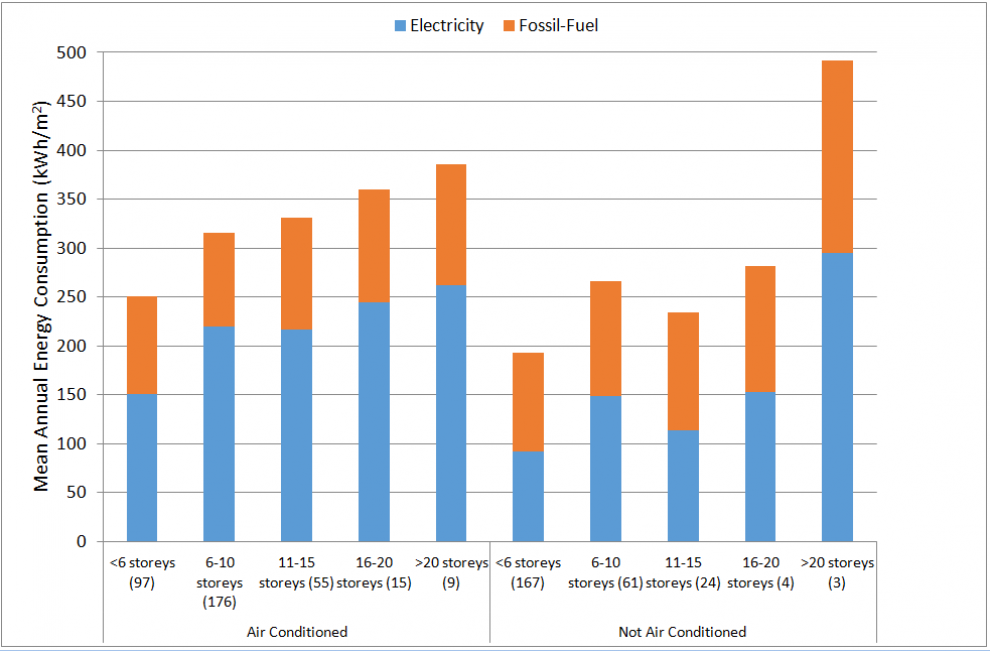 Figure 3: The results for carbon emissions of Figure 1 divided between air-conditioned (left) and non-air-conditioned buildings (right)
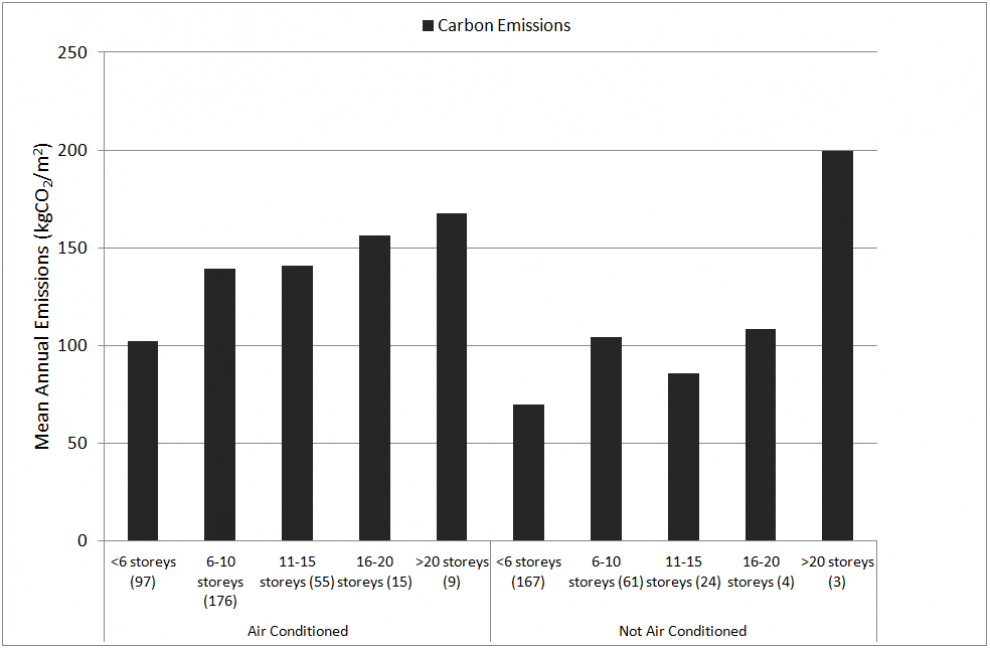
Figures 2 and 3 show the effects of the use of of air conditioning on energy use and emissions (again excluding electrically-heated buildings). Each graph is divided into two halves, showing buildings that are air-conditioned (left) and buildings that are not air-conditioned (right). The heights are aggregated into five bands as before. Comparing the trends, it can be seen that the increase in electricity use is more gradual in the buildings without air conditioning, but that it reaches a similar value to the air-conditioned buildings at 20 storeys and above. (It should however be noted that almost all of the tallest buildings have air conditioning, so the results for this height group should be treated with caution.) Emissions from the ‘high-rise’ air-conditioned buildings are more than one and a half times greater than in the ‘low-rise’ air-conditioned. In buildings without air conditioning, this difference is much greater (with the proviso above).
These findings have been further analysed, to study their relationship to building age, location (by region and central city/ suburb), rateable value (a measure of ‘prestige’), plan depth and the ratio of exposed surface to volume, structural system, and glazing ratio.
- 2. Energy use and height in residential buildings
- A different approach has been taken to energy use in the residential stock (houses and blocks of flats), since it proved difficult to obtain data on actual electricity and gas consumption for large numbers of individual buildings. In these circumstances, the project has used statistical methods to study the relationship of the combined energy use of all domestic buildings to their collective built form, within Lower Super Output Areas (LSOAs) in twelve London boroughs. An LSOA is a spatial unit designed for Census purposes: in residential areas it would contain typically between 400 and 1200 households.
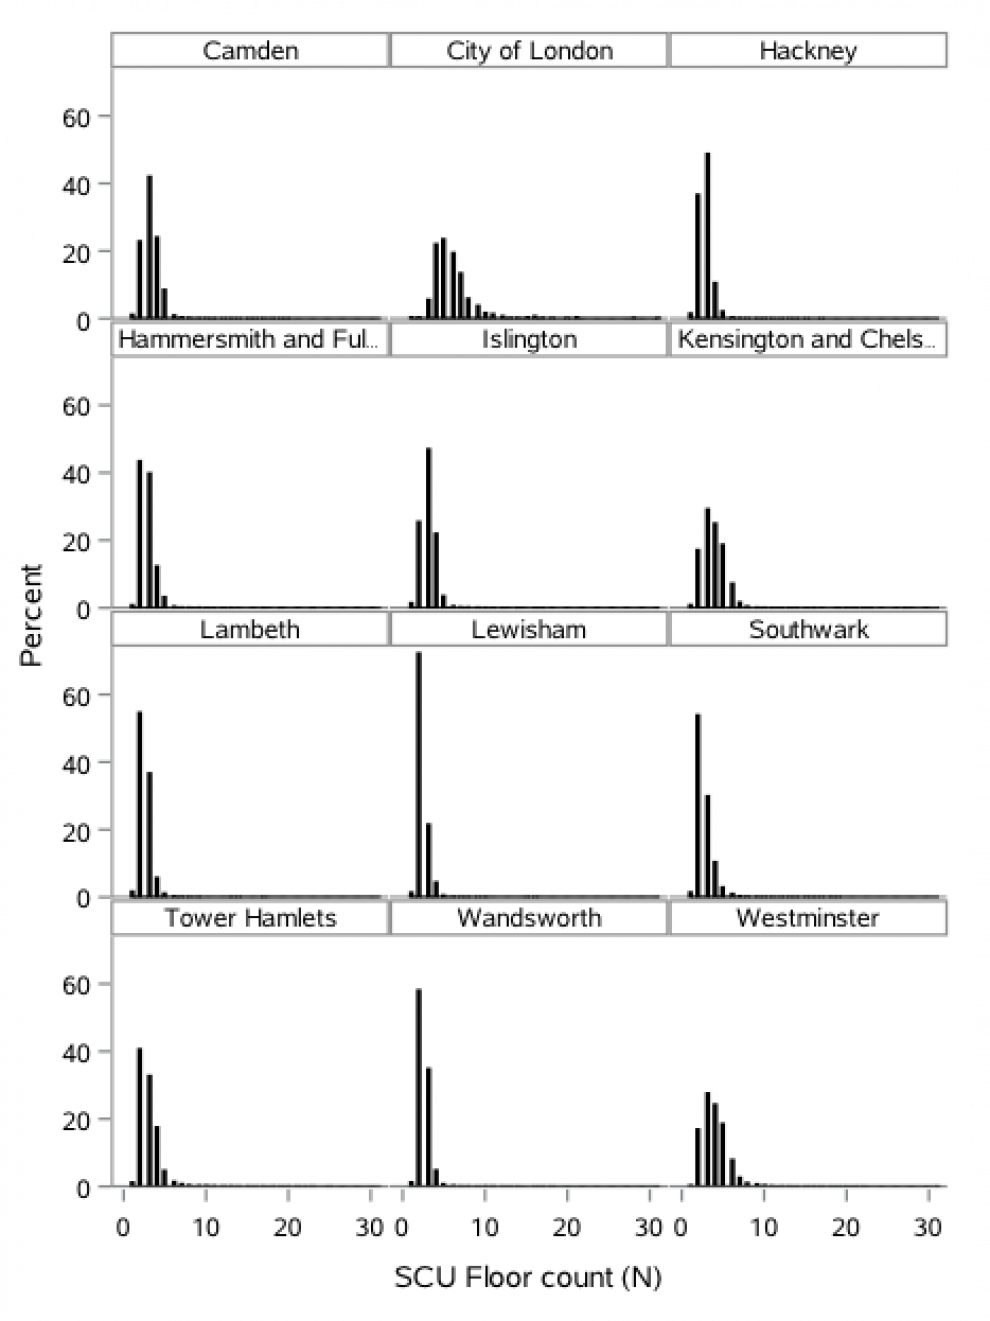
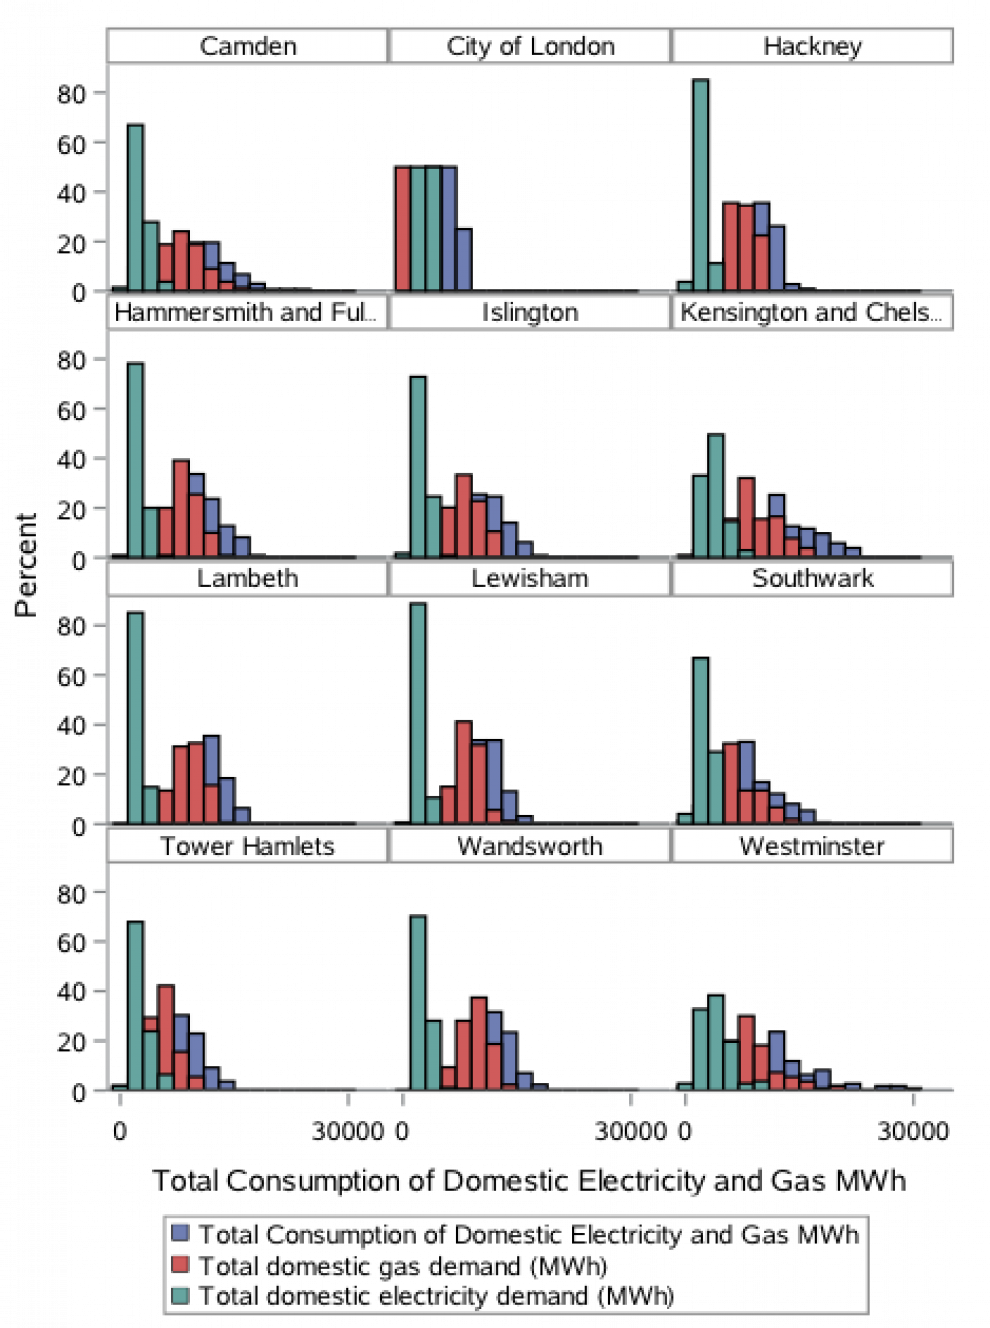
Figure 4: (a) Distributions of residential building height (metres) (Left), and (b) total domestic energy use (MWh/year) in twelve London boroughs (Right)
For each LSOA, the built form of the residential buildings is derived from the 3DStock model. (The measurements are made on so-called Self-Contained Units (SCUs), which for the present purposes can be taken to be the same as buildings.) Data are publicly available on total quantities of domestic gas and electricity supplied to LSOAs. Figure 4a shows how SCU height (number of floors) is distributed in the twelve boroughs. See how the heights in lower-density, predominantly residential boroughs like Wandsworth and Hackney are clustered around 3 and 4 storeys; while in higher-density boroughs like the City and Westminster, there are more taller buildings, many of them blocks of flats. Figure 4b shows total consumption of domestic electricity and gas by LSOAs in the same boroughs.
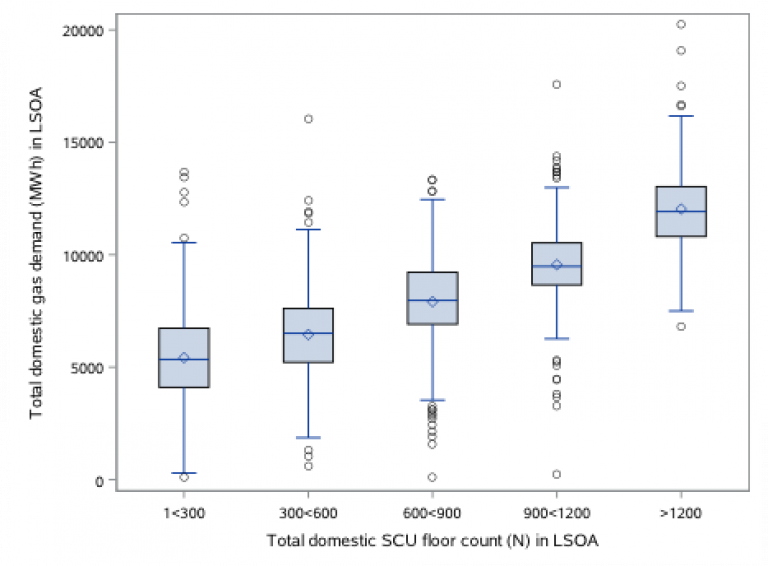
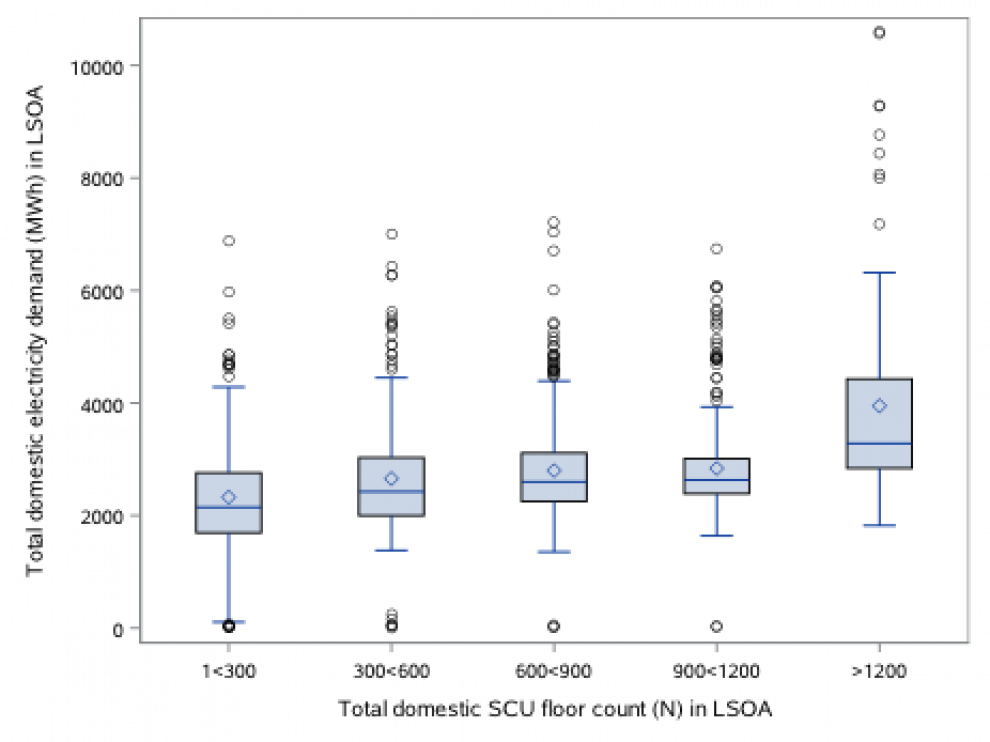
Figure 5: (a) Total gas (L) and (b) total electricity use (MWh/year) against total of all floors in residential buildings in Lower Super Output Areas (R)
A linear regression model has been used to assess the relative impacts on electricity and gas use of a series of factors including the height, volume, and exposed surface area (walls and roofs) of buildings, as well as some non-geometric variables including numbers of residents and percentage of dwellings having central heating. Figure 5 plots (a) total domestic gas use and (b) total domestic electricity use (MWh/year) against the number of domestic floors in each LSOA. (The numbers of floors in every domestic building are added together to give a ‘total height of all buildings’.) There is a very marked increase in gas use with height, but only a small increase in the use of electricity. (These are the opposite trends to those found in offices, where electricity use increases steeply with height.) The regression model shows that in areas of London where residential buildings are generally taller, the addition of an extra meter of height adds 0.9 MWh/year to the gas consumption of an LSOA.
- 3. Density and built form
- Many people believe that high densities can only be achieved with tall buildings. This is by no means true in all cases. Density is powerfully affected by built form. In the 1970s Leslie Martin and Lionel March showed that, all other things being equal, slab blocks could achieve higher densities than towers on the same sites; and that court forms could achieve higher densities than slabs. The ratio between the densities of the three types of form (courts: slabs: towers) could go as high as 3: 2: 1. Meta Berghauser Pont and Per Haupt have recently measured the densities of large numbers of Dutch residential estates and have provided empirical confirmation of these counterintuitive theoretical findings.
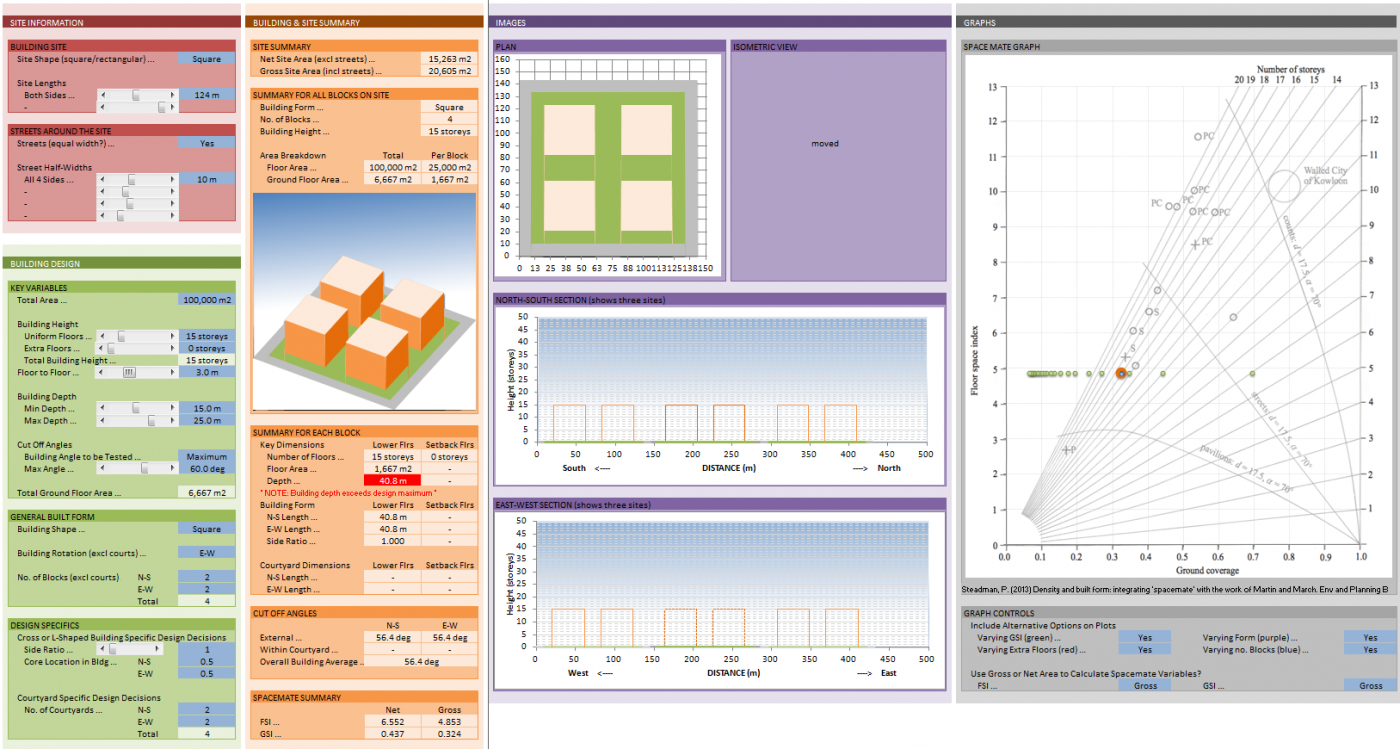
Figure 6: Built form and density calculator developed in the project, showing data entry, images of built forms, and the Spacemate diagram (right)
A spreadsheet model has been developed in the present project, incorporating Berghauser Pont and Haupt’s ‘Spacemate’ tool (Figure 6). This allows the user to specify a total floor area for a building, and the size and shape of the site. The model then determines the number of storeys needed to accommodate this floor area in a range of built forms - either towers, slabs, courts or cruciforms. Plan depth, and the spacing between a building and its neighbours, can be controlled. The building form is shown graphically, and its position is plotted in the Spacemate graph whose axes measure Floor Space Index (density) and Ground Space Index (ground coverage).
It is thus possible to work out, for a given site and a specified density, what range of built forms is available to the architect and developer. Given that the project has found large increases in operational energy use with increasing height of buildings, this density work shows how lower-rise buildings could in many circumstances reduce energy consumption without sacrificing density. Tall towers could be replaced with slabs or courts in many actual and planned developments in London, to provide the same floor area on the same sites. These options depend critically however on the sizes of sites.
- 4. Simulation studies of the possible physical causes of increases in energy use with height
The studies of both offices and dwellings have shown that energy intensity increases sharply with height; but they have not provided a full explanation of these results. Notice that in the case of the offices, the cause is not that the taller buildings tend to be air-conditioned and the lower buildings tend to be naturally ventilated: the effect is seen in non-air-conditioned buildings of all heights. Analysis also shows that the explanation is not to be found in the different ages of the office buildings, nor in the fact that taller offices are more likely to be ‘prestige’ buildings – whatever exactly that means – as indicated by their rateable values. Rateable values are low for buildings on 6 storeys or fewer, but otherwise are broadly unrelated to height. On the other hand, glazing proportion does increase systematically with height, as might be expected, suggesting that one cause may be to do with heat loss and heat gain.
At present it is only possible to speculate: but there are potential physical effects relating to height in itself that could be at work. Specifically there is a general increase in wind speed and a lowering of average temperature with increasing height above ground, to which taller buildings are more exposed. Buildings that rise above their neighbours are also not as overshadowed, and experience greater solar gains. It seems possible that such effects have not been properly allowed for in some previous exercises using simulation models. The effects can however be modelled. Work is in progress to investigate these physical hypotheses for a sub-sample of the offices, using two different customisations of the EnergyPlus tool. The geometry of the target buildings and their neighbours is being taken from the 3DStock model of London.
- Acknowledgements
The project was funded by the Engineering and Physical Science Research Council. Energy and floor area data for offices were kindly made available by the Better Buildings Partnership and the London Mayor’s Energy Challenge. We are grateful for special help from Chris Botten of BBP and Paul Ruyssevelt of the Energy Institute.
Enquiries to Philip Steadman (j.p.steadman@ucl.ac.uk) or Ian Hamilton (i.hamilton@ucl.ac.uk)
- References
M Berghauser Pont and P Haupt, Spacemate: The Spatial Logic of Urban Density, Delft University Press, Delft 2004
I Hamilton, S Evans, P Steadman, D Godoy-Shimizu, M Donn, H Shayesteh, G Moreno, ‘All the way to the top! The energy implications of building tall cities’, CISBAT 2017 International Conference, Lausanne, Switzerland
S Evans, R Liddiard, P Steadman, ‘3DStock: a new kind of three-dimensional model of the building stock of England and Wales, for use in energy analysis’, Environment and Planning B: Planning and Design, 2016
L Martin and L March eds, Urban Space and Structures, Cambridge University Press 1972 pp.35-38
Photo credit: Pixabay Stevebidmead CC0 Public Domain