 Close
Close

A new database and 3D model of energy use in the national non-domestic building stock
7 July 2014

A team at the UCL Energy Institute led by Professor Philip Steadman is developing a new type of database/ model of the national non-domestic building stock. Other members of the team are Dr Rob Liddiard, Stephen Evans of the consulting firm 3Figs, and Dr Brian Coffey. The methods are being tested in case studies of the London Borough of Camden and several other locations. The eventual intention is to cover the whole of England and Wales.
Construction of the model depends on bringing together two existing data sets: Ordnance Survey Address Base (OSAB) maps, and commercial rating (property taxation) data from the Valuation Office Agency (VOA). Because rates are levied on property not land, the VOA makes detailed surveys of the majority of non-domestic premises in the country. The VOA’s Summary Valuation (SMV) database classifies all premises by their primary activity – for example wine bar, community centre, or cold store - and gives floor areas by floor level. These floor areas are further broken down by sub-activities, so that for example a car showroom might be divided into sales areas, offices, storage and so on. The basic unit with which the VOA deals is the premises, or in its terms the ‘hereditament’. A hereditament is a piece of floor space with a single owner or occupant, and may correspond to a part of a building, a whole building, or a group of buildings on a shared site such as a university campus or large factory.
To construct the new model, VOA hereditaments are matched by their addresses to footprints in the digital maps. This is a complex process, in part because of inconsistencies in address formats, but also because many footprints relating to parts of non-domestic hereditaments are unaddressed, and need to be ‘captured’ using intelligent matching algorithms developed by Stephen Evans. Evans has achieved a 98% match rate for addresses in Camden. Once footprints and hereditaments are matched, then the floor area can be piled up level by level on the footprints to create 3D models of ‘buildings’. Overall height data are available from LiDAR measurements, made with lasers from overflying aircraft.
We refer to these 3D models as ‘self-contained units’ (SCUs) following the work of Taylor et al (2014). A SCU is not the same as a building, if the word ‘building’ is used in the architectural/ constructional sense to mean a structure designed and erected all at one time in a single style and in homogeneous materials. A SCU can contain more than one ‘building’ in this sense. The SCU has three important characteristics. It does not cut any hereditament into two or more parts (except where the hereditament already consists of several discrete parts). Thus, for example, if a shop hereditament has expanded from one building into an adjoining building, then the SCU is defined to contain both those buildings. A SCU has a well-defined thermal envelope through which heat is lost or gained. And a SCU is a unit for which - in most cases - it is possible to know the overall relationship between the total floor area contained, and the electricity and gas supplied to that floor area.
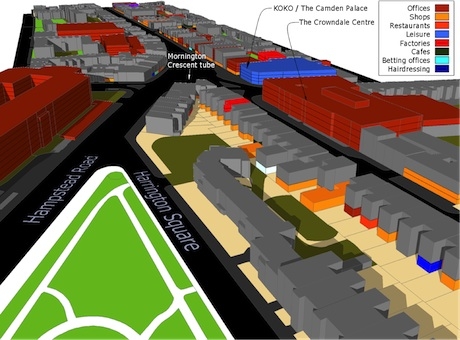
Figure 1 shows a visualisation of self-contained units in an area of the Borough of Camden around Mornington Crescent underground station. The colours code for the predominant activity in each SCU. Many SCUs contain several hereditaments of the same or different activity types. Thus a large office SCU can contain many office hereditaments corresponding to individual tenants. It may also contain say shops on the ground floor, or a health club in the basement. The grey tone in the figure indicates floor space that is not non-domestic, and in most cases is in houses or flats. Thus there are SCUs along Camden High Street that have shops or cafes on the ground floor and flats above.
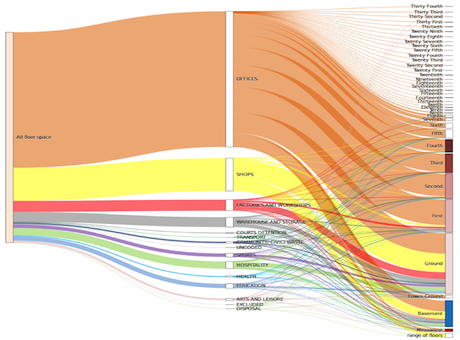
Figure 2 is a Sankey diagram giving a breakdown of total SMV floor area in Camden by floor level. Office activity dominates and is found on all levels. Shops are found predominantly at ground level and in basements. When floor levels are ranked by their total amounts of non-domestic floor area, the third largest after ground and first floors is the basement level.
Geometrical measures relevant to energy performance can be taken off SCUs, including volumes, exposed surface areas and plan depths. Other data relating to materials of walls and roof, and estimates of ages of buildings, are being incorporated. The GeoInformation Group has been commissioned to collect these data for Camden. Similar data are collected nationally by the Valuation Office Agency. The VOA does not currently make these available; but they might do so in the future.
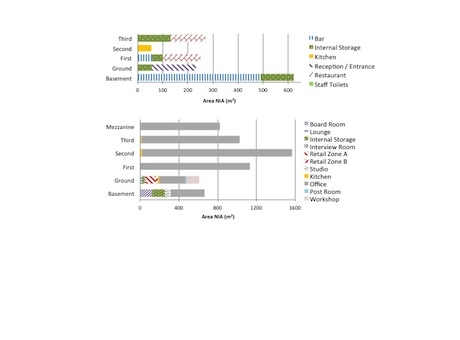
As mentioned, the SMV database breaks down total floor area within a hereditament into sub-activities. Figure 3 shows the breakdown by floor levels and sub-activities of two SCUs visible in Figure 1, a music venue and a Camden Borough office. Rob Liddiard has used these data to develop a model of electricity use by appliances and lighting. The model takes results from a survey of some 700 premises made by a team from Sheffield Hallam University (SHU) in the 1990s. The SHU team went room by room in each premises, collecting information on every piece of equipment, its power rating, and its hours of use. These data were reconciled with total consumption figures for electricity and gas obtained from the supply companies. Liddiard has used the SHU data to derive typical schedules of equipment and light fittings for sub-activity areas – e.g. office rooms, kitchens, stores and computer rooms in office premises. Some figures - particularly for lighting and IT equipment - have been updated to allow for the lapse of time since the SHU surveys. These schedules are then associated with equivalent sub-activity areas in the SMV data. Liddiard’s model has been tested for the City of Leicester, and in Camden.
Brian Coffey is developing a second energy model using a special customisation of the EnergyPlus simulation package. This takes data on SCUs relating to their geometry, materials, age and activities from the 3D models. Internal gains from equipment and lighting are derived from Liddiard’s model. Default assumptions are made about other parameters - for which actual data might be obtained in the future - such as occupancy hours, the presence of air conditioning, and glazing ratios. Coffey’s model then calculates heating and cooling demand, and estimates total consumption of electricity and gas. Provision is made for the development of future scenarios in which parameter values are changed, to reflect different conservation measures and new technologies.
The model is still under development. But when it is complete, the intention is to make runs for very large numbers of SCUs and scenarios automatically. When energy data are available for individual premises – as for example where buildings have Display Energy Certificates – model predictions can be compared with actual consumption. Otherwise aggregated predictions can be compared with the aggregated totals for energy use published for census districts by the Department of Energy and Climate Change.
Much work remains to be done on the Camden case study. This includes work to make estimates of floor areas for activity types - including hotels, pubs and churches – in cases where these are missing from the SMV. Methods need to be developed for dealing with campus type hereditaments. A new ‘Sites’ product from the Ordnance Survey, which gives site boundaries for campuses, promises to be useful in this context. More refinements could be made to the address matching methods and the two energy models. The approach as a whole could usefully be tested on other areas besides Camden, especially provincial and suburban localities, and places with large numbers of industrial buildings – of which there are only a few in Camden.
It should be emphasised that once address matches are achieved, the production of the SCUs and the associated energy models are completely automated processes. It is thus by no means out of the question, given sufficient computing power, to extend the method to the whole of England and Wales. (The VOA databases do not cover Scotland or Northern Ireland, where the rating processes are slightly different. Suitably modified approaches would be needed for extensions to the entire UK.) We see two kinds of approach to policy issues for energy conservation and decarbonisation, based on this work. The first is the simulation approach using the EnergyPlus tool. The second is a purely statistical or ‘epidemiological’ approach - made possible by the use of these very large data sets for large parts of the stock - designed to identify properties and features of existing buildings that have significant effects on consumption. The two approaches are complementary, and can inform each other.
More details of the models and methods are given in the attached paper, ‘A 3D geometrical model of the non-domestic building stock of England and Wales’, delivered to the Building Simulation and Optimisation 2014 conference held at University College London in June.
Reference:
Taylor, S, Fan, D and Rylatt M (2014) ‘Enabling urban-scale energy modelling: a new spatial approach’, Building Research and Information, 42, pp.4-16
Figure 1: ‘Self-contained units’ (SCUs - roughly, buildings) in an area of the London Borough of Camden. Colours code for the predominant activity in each SCU. Grey is mostly domestic.
Figure 2: Sankey diagram giving a breakdown of total non-domestic floor area in Camden, as given by the Valuation Office Agency’s SMV database, by floor level.
Figure 3: Breakdown of sub-activities between floor levels for two SCUs in Camden, a music venue and a local authority office.