CryoSat-2 satellite redraws Arctic sea-ice map
21 June 2011
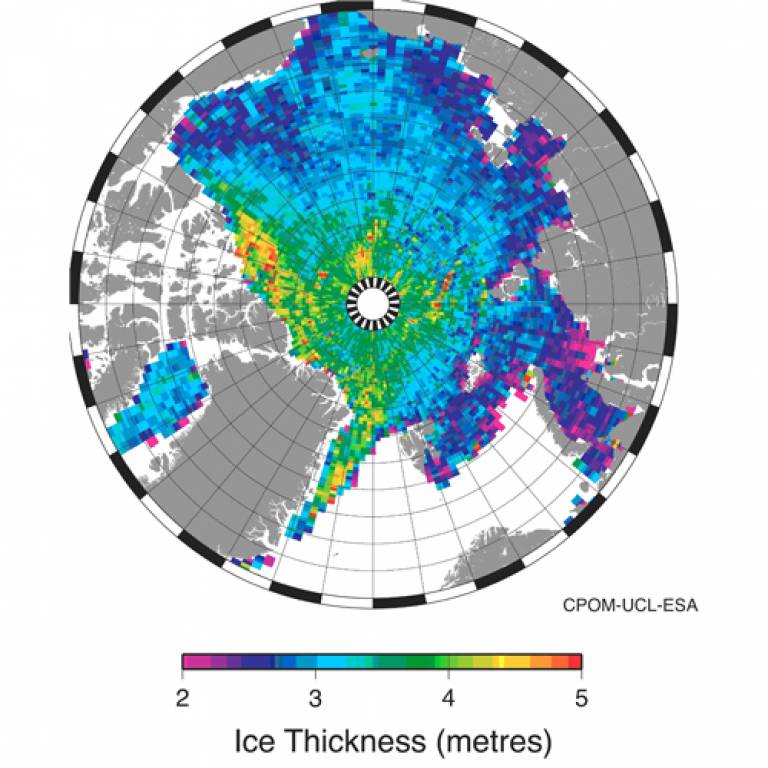
Scientists at UCL have produced the most extensive map of Arctic sea-ice thickness yet using just two months' worth of data from the European Space Agency's ice mission, CryoSat-2.

Data from the satellite has also helped them create an updated map of ocean circulation in the Arctic, and a topographical relief map of Antarctica. All three maps demonstrate that CryoSat-2 is working well and, in some cases, is exceeding expectations.
'This is the first time we've been able to measure sea-ice thickness over almost the entire Arctic ice pack,' says Dr Seymour Laxon, director of the Centre for Polar Observation and Modelling (CPOM) at UCL.
'The map shows clear agreement with data gathered from aircraft during a recent Arctic campaign, showing that CryoSat-2 can accurately measure changes in ice thickness.'
'We can't yet say anything about changes - for that you need a longer dataset,' he adds.
The sea-ice thickness map is based on data from January and February 2011 and shows thicker, rough, multi-year ice - which has survived last summer's melt - north of Canada and Greenland, stretching to the North Pole and slightly beyond. Elsewhere in the Arctic the map reveals thinner, first year ice, and corresponds well with maps produced by other researchers.
'Other European Space Agency satellites, like Envisat and ERS-1 have let us build a map of sea-ice thickness up to 81.5 degrees north. But CryoSat-2 goes right up to 88 degrees north, which means we've got more coverage up to the North Pole,' says Dr Katharine Giles, also from CPOM.
CryoSat-2 is designed to take precise measurements of changes in the thickness of ice in the Arctic and Antarctica, helping scientists understand how melting polar ice could affect ocean circulation patterns, sea-level rise and the global climate.
The satellite measures the thickness of polar ice using an instrument called an altimeter, which fires pulses of microwave energy at the ice and records how long they take to return.
Researchers at CPOM calculate the thickness of the ice by comparing how long it takes for the echoes to return from the top of ice floes and from the water in cracks in the ice, called leads. The aim is to measure the freeboard - the part of the ice that sits above the waterline.
The satellite can also tell scientists how winds affect the Arctic Ocean by measuring differences in the height of the sea surface exposed between ice floes.
Echoes returning from leads have a much sharper signature than echoes from the ice. It's this data that has let the CPOM researchers to produce a map of ocean circulation in the Arctic using CryoSat-2 data.
They created a similar map in December 2010. But most of the data for that map came from another ESA satellite called Envisat. The CPOM team used CryoSat-2 data to plug a huge hole over the North Pole left by Envisat.
CryoSat-2 can also measure the height of the ice around the edges of Greenland and Antarctica, which is important for understanding changes in ice thickness.
To test how well it does this, the researchers switched the satellite to a different measurement mode as it passed over a prominent chain of mountains under the sea around Hawaii. The mountains in the Hawaiian-Emperor Seamount Chain are so enormous they change how gravity acts on the ocean above them, creating slopes and troughs at the surface.
'We were astonished to find we could measure tiny changes in the ocean surface caused by the seamounts lying deep under water,' says Dr Natalia Galin, also from CPOM at UCL.
The satellite is in a polar orbit around 700 kilometres above the Earth. It's expected to be in operation for three years, 'but has enough fuel onboard to keep going for up to seven years,' says Professor Duncan Wingham from CPOM at UCL, who conceived the idea for CryoSat-2 more than ten years ago.
Cryosat-2 was launched onboard a Dnepr rocket - a converted intercontinental ballistic missile - from the Baikonur cosmodrome in Kazakhstan on 8 April 2010.
This article is reproduced from a piece that first appeared in NERC's online magazine Planet Earth.
Images: A plot of Arctic sea ice thickness (top) A plot of the Arctic sea surface height (middle) Elevation
map of Antarctica from January and February 2011 from CryoSat-2 (bottom) Credit: CPOM/UCL/ESA
Links:
 Close
Close

