- Introduction
- 1. Introduction to Quantitative Analysis
- 2. Descriptive Statistics
- 3. T-test for Difference in Means and Hypothesis Testing
- 4. Bivariate linear regression models
- 5. Multiple linear regression models
- 6. Assumptions and Violations of Assumptions
- 7. Interactions
- 8. Panel Data, Time-Series Cross-Section Models
- 9. Binary models: Logit
- 10. Frequently Asked Questions
- 11. Optional Material
- 12. Datasets
- 13. R Resources
- 14. References
- Published with GitBook
Interpreting Zelig Simulation
Make sure that you've read this note: Why Zelig?
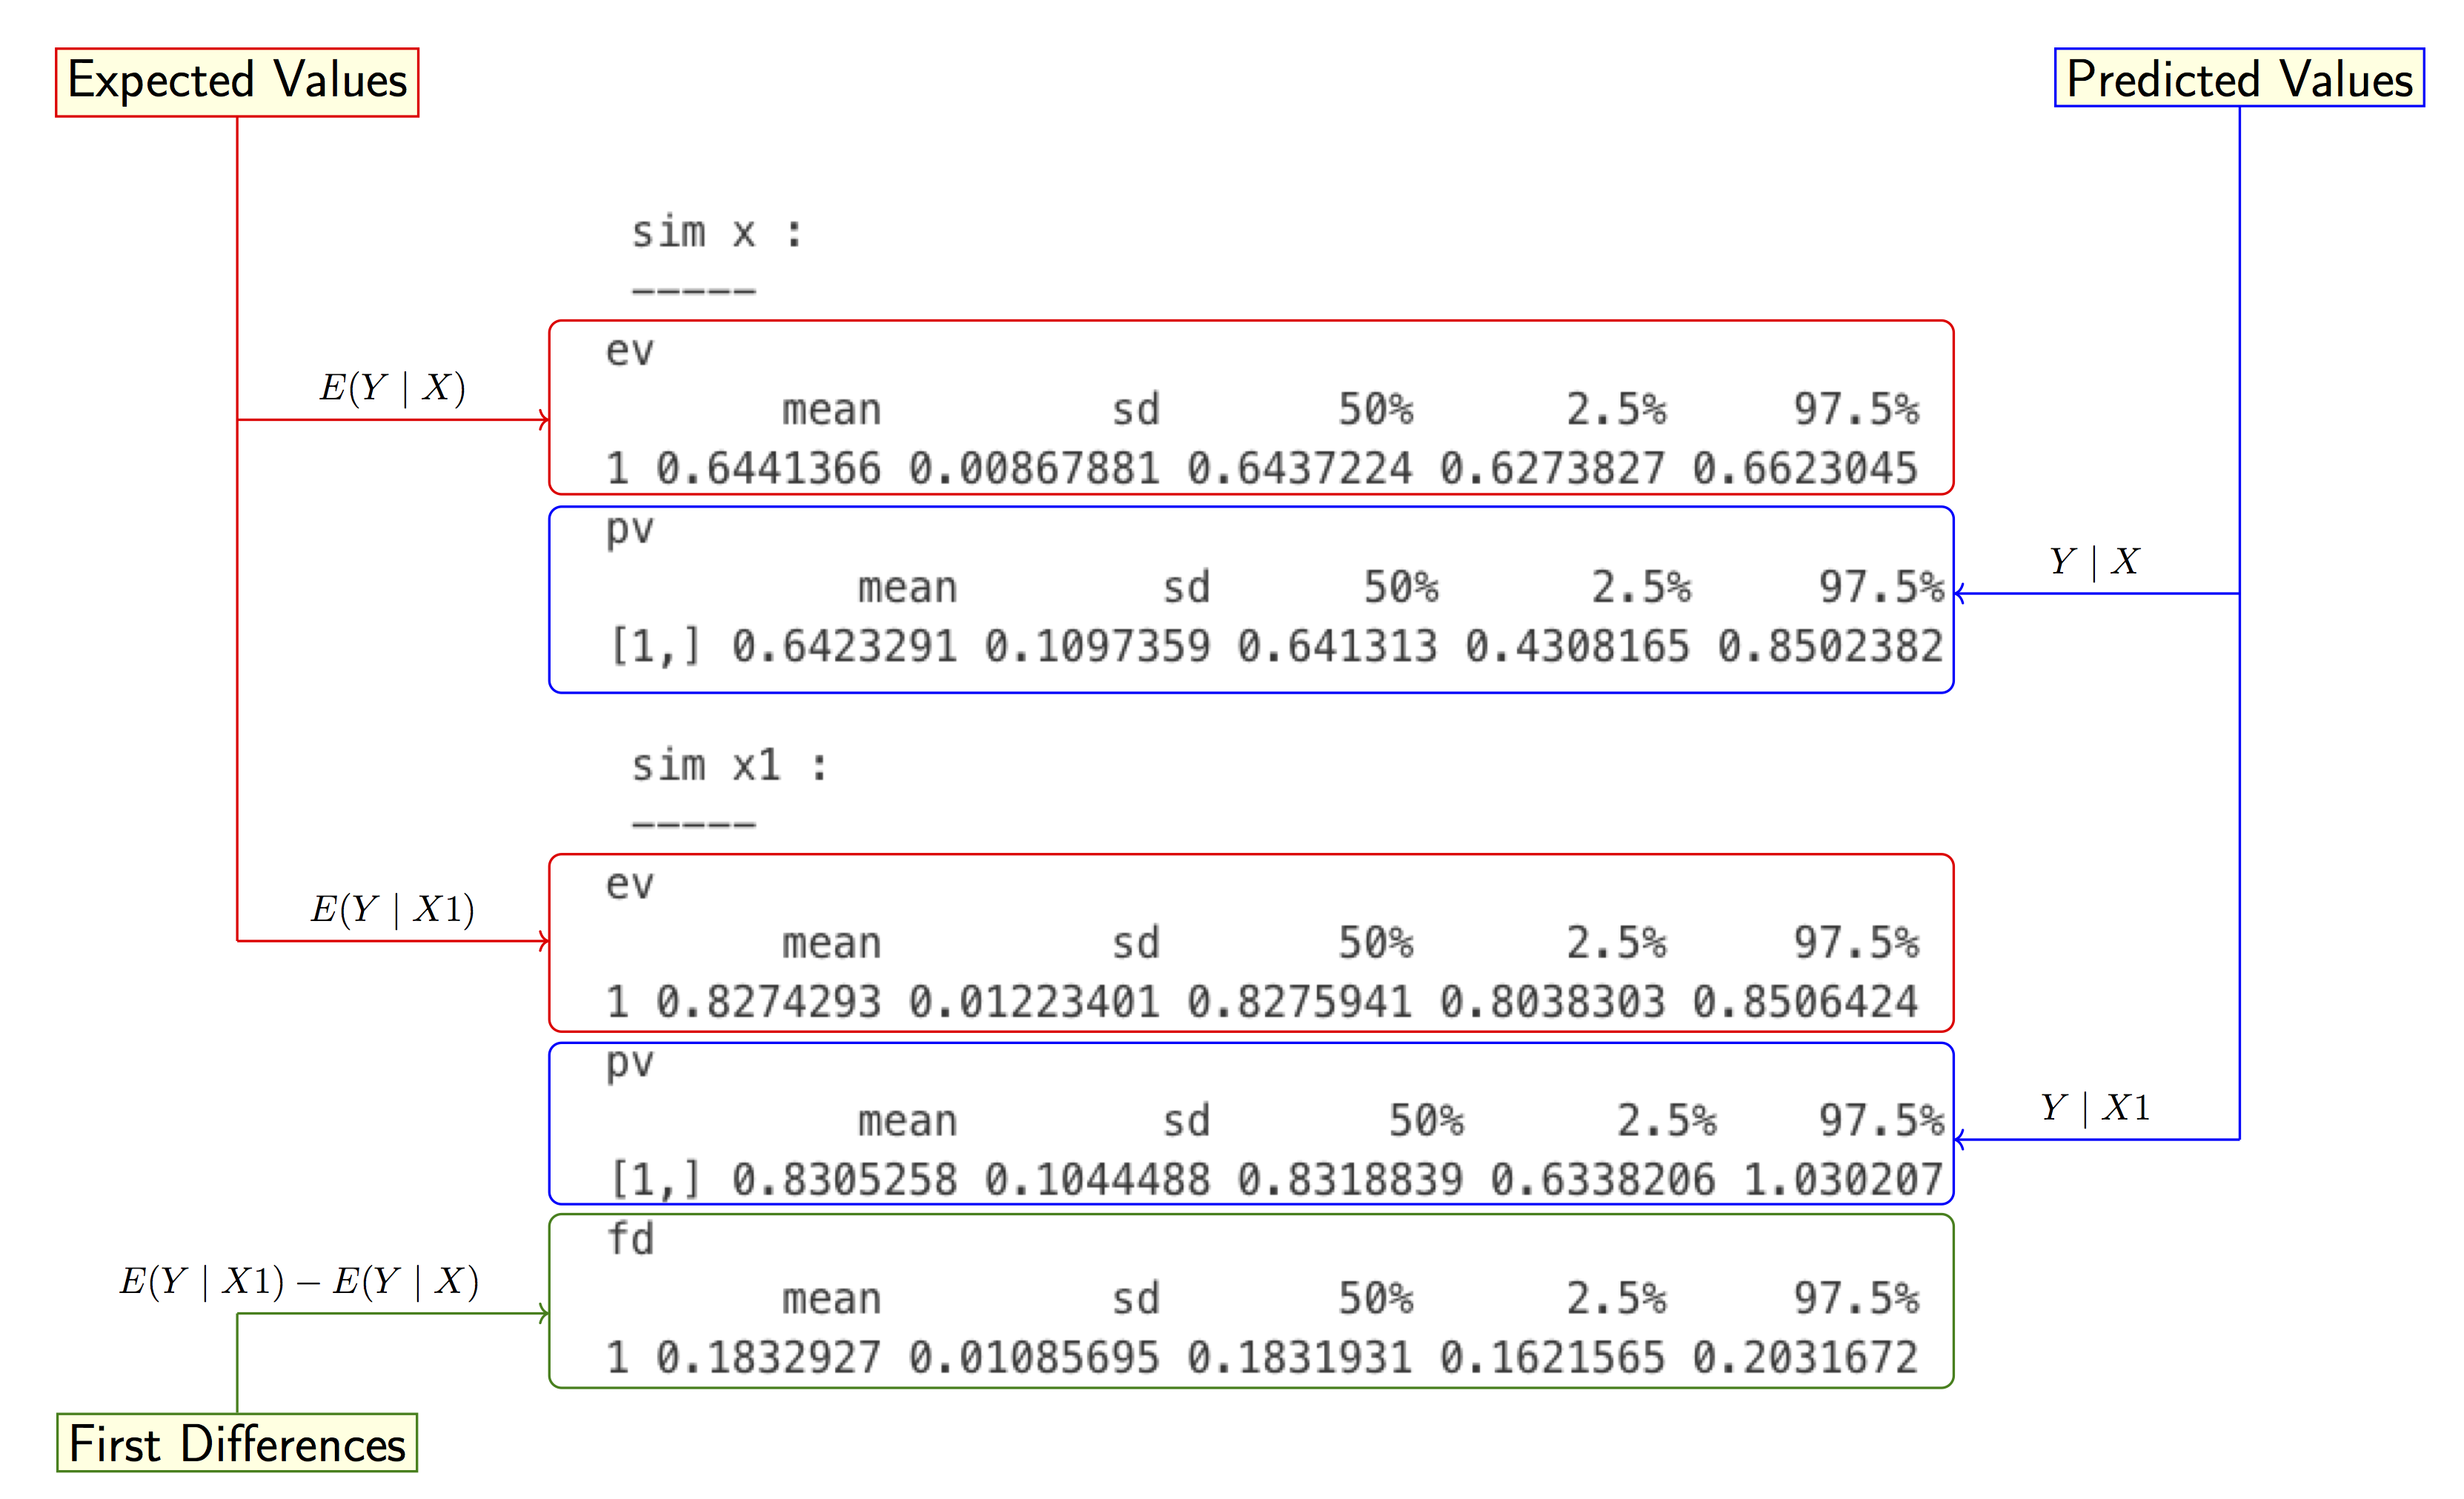
The example is based on the solutions for exercise 1 in seminar 7. The simulation predicts the effects on human development index (HDI) when GDP per capita increases from $5000 to $15000.
The authors of the Zelig package have a paper that describes statistical simulation in great detail. Some of it is a bit technical but the general concepts, especially in the beginning might be helpful: http://gking.harvard.edu/files/making.pdf
Overall Summary
First let's take a look at the three main sections of Zelig simulation summary. The exercise sets the explanatory variables X and X1 in the code below:
x.low <- setx(z.out, gdp = 5000)
x.high <- setx(z.out, gdp = 15000)

s.out <- sim(z.out, x = x.low, x1 = x.high)

summary(s.out)

Expected Values, Predicted Values and First Differences
The simualtion results for explanatory variables X and X1 both include the expected values E(Y|X) and E(Y|X1) as well as the predicted values Y|X and Y|X1 from the simulations.
The first differences between the two expected values E(Y|X1)−E(Y|X) follow the simulation results for X and X1 .
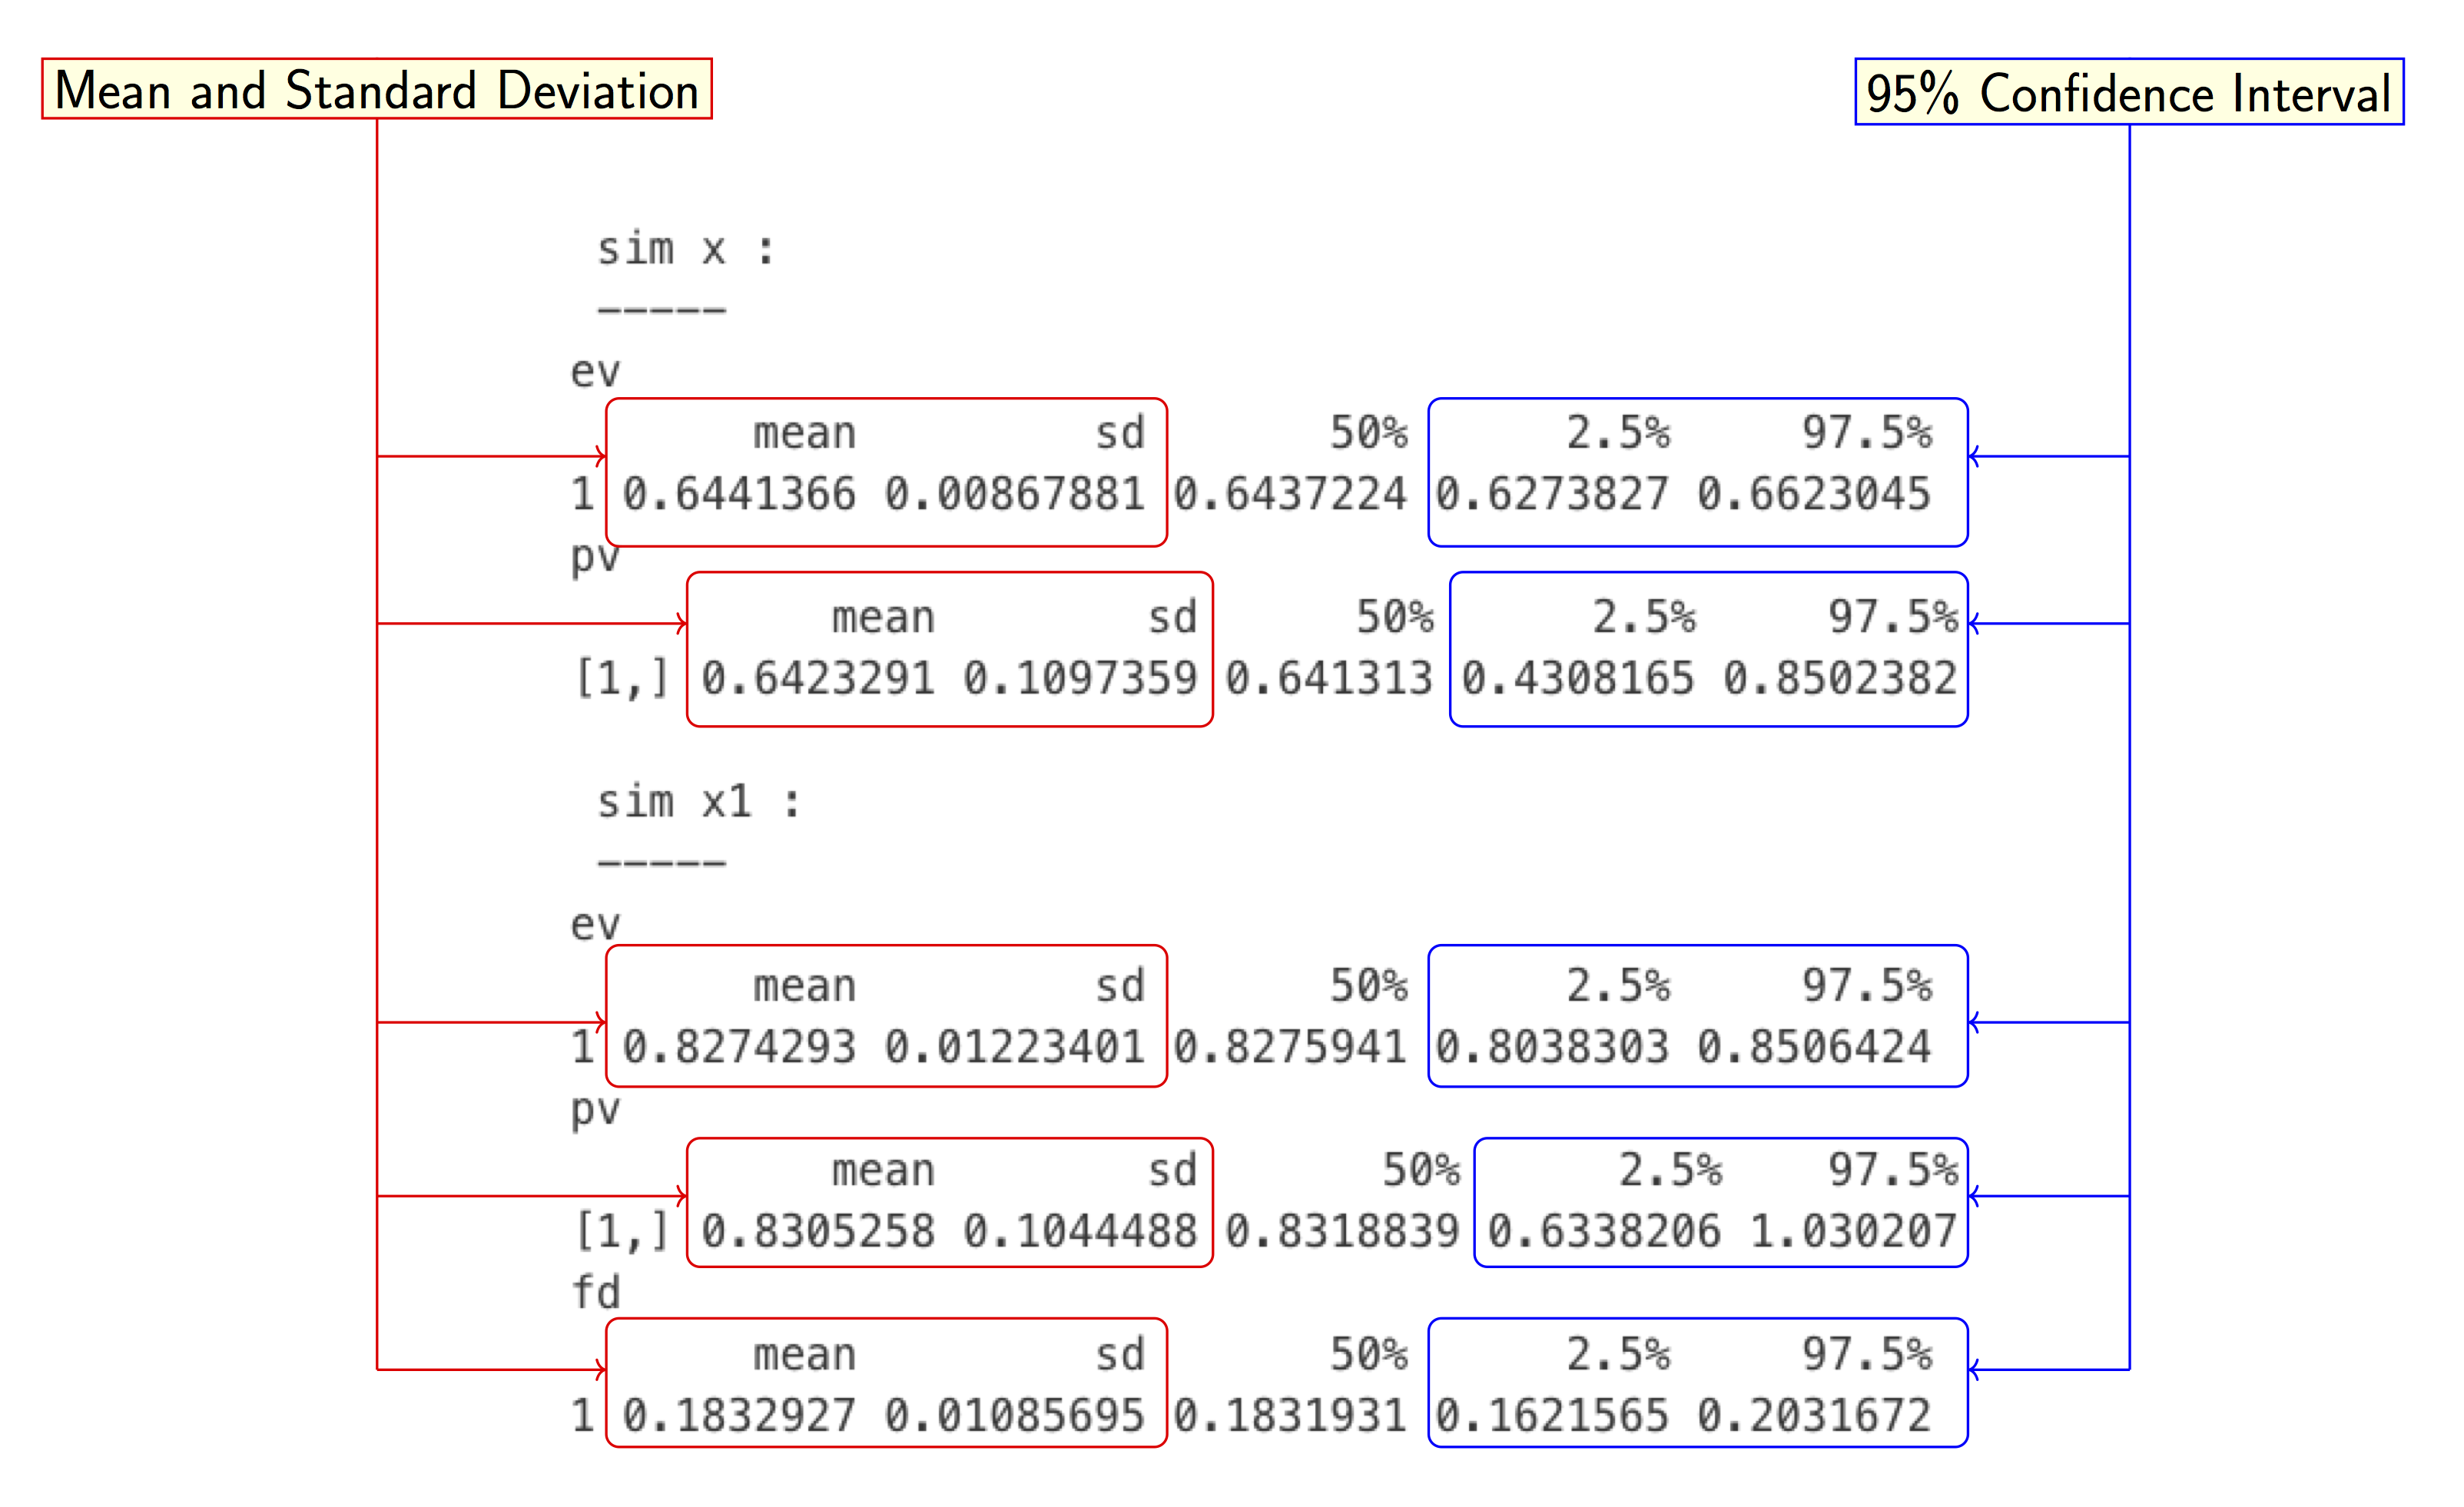
Mean Estimate and Confidence Interval
Each row of statistics for the expected and predicted values for
X
and
X1
include the mean estimate for
Y
, the standard deviation, the median, and the 95% confidence interval.