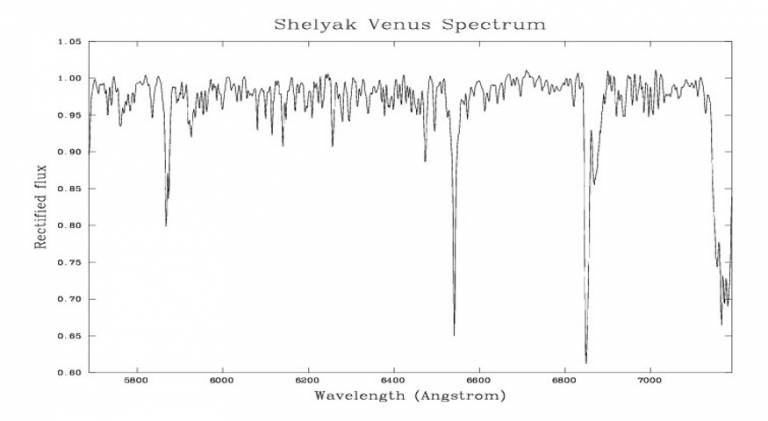
Both these have been discontinued. The C14s will make use of slitless holographic transmission gratings while the new Perren telescope will have a fibre-fed high resolution spectrometer. As commissioning takes place, more details will be added to this page.
Stellar spectroscopy
The Allen telescope spectrograph was historically used to take spectra of stellar and nebular sources, for example to investigate element-abundance variations in stars, or to measure the densities and temperatures of gaseous nebulae.
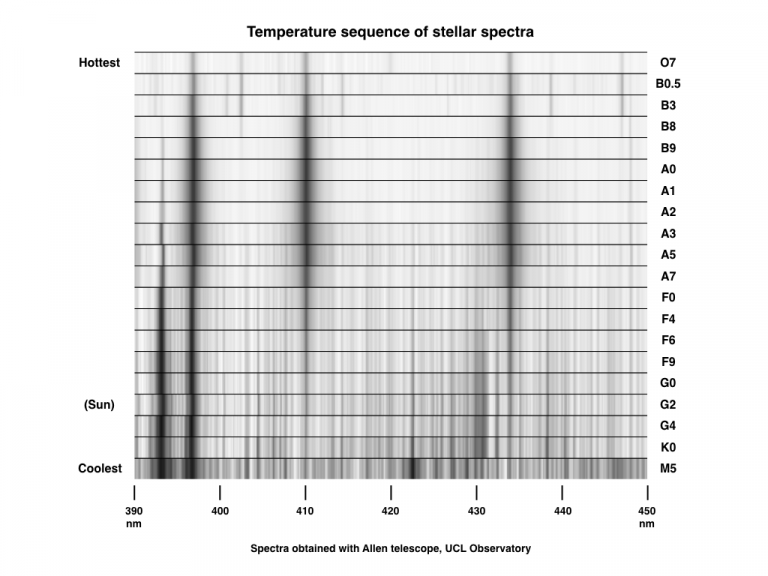
The following image is a (greyscale) composite of stellar spectra taken with the Allen telescope which shows the familiar `OBAFGKM' sequence of stellar spectral types, which depends on the surface temperatures of different stars.

Supernova spectroscopy
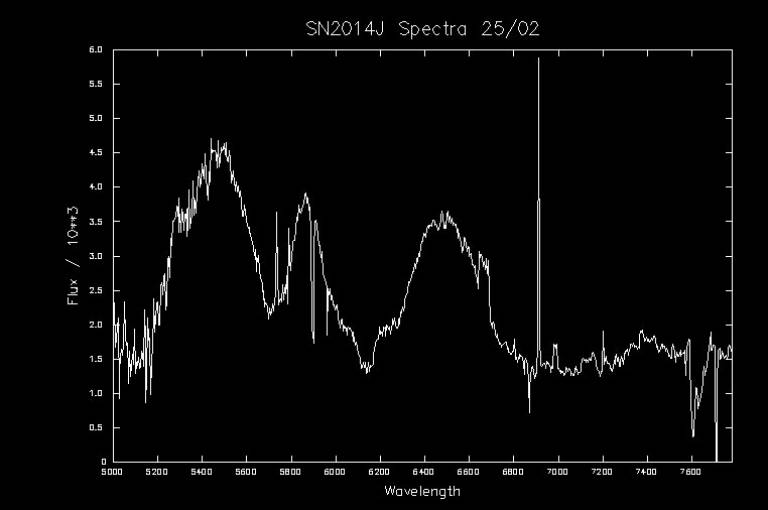
The supernova SN2014J in the galaxy Messier 82, discovered at UCLO, was the nearest and brightest Type Ia supernova since at least 1972. UCL students decided to obtain a spectrum of the supernova `fireball' a few weeks after the discovery, using the Allen telescope and spectrograph: the first supernova spectrum obtained at UCLO. This was a challenging observation since the source was relatively faint for the spectrograph design in use, and comprised about 2 hours' total integration on the object. The spectrum, shown below, shows strong absorption lines of elements (eg, Si, Fe, Mg) which were formed in the supernova explosion; the lines are very broad, which reflects the fast expansion of the supernova shell of hot gas.

Visible-light spectrum of SN2014J, by Krishna Naidoo and Jasleen Matharu, obtained on 2019 Feb 25 with the Allen telescope and spectrograph at UCLO. (The x-axis is wavelength in Angstroms, and the y-axis is relative flux.) Image credit: Jasleen Matharu/Krishna Naidoo/UCLO.
 Close
Close

