![]()
Version 0.8 beta
Latest updates 14 October 2008. New versions of HJCFIT, AUTPLOT and PLOTSAMP
These programs are written for Microsoft Windows in 32-bit Intel Visual Fortran with Gino graphics. They will supersede the DOS programs that we have made available for some years now. They also supersede the trial Compaq Fortan for Windows versions They are free for educational institutions (please email me for prices for industrial use).
The following are now available as full Windows programs. Register (at the top) and go to the download page.
HJCFIT our flagship fitting program, See screenshots here.
AUTPLOT Automated plotting of the graphical output, queued by other programs
PLOTSAMP Plotting, filtering and cropping of raw data
CONSAM Continuous sampling of raw data with storage on disk, for analysis by SCAN (for CED 1401 digitising interface)
SCAN is available in a Windows version as part of CED's Signal 5 suite of programs.
![]()
Version 0.8 beta
In order to fit real observations it is essential to allow for the fact that brief events are undetected. The likelihood is calculated in this program by using the method of Hawkes, Jalali & Colquhoun (1990, 1992) to calculate the HJC distributions. These are the distributions of what is actually seen. e.g. of apparent open times, with exact allowance for the fact that apparent openings are often extended by missed brief shuttings.
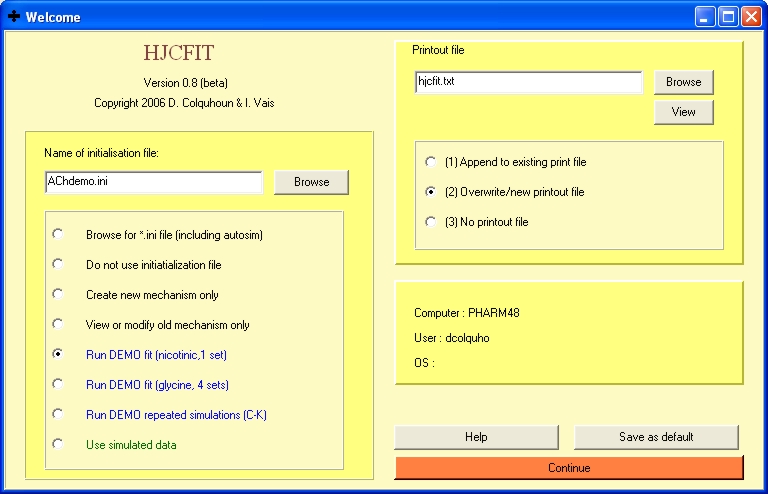
Clicking on one of the DEMO options will run a complete fit with no action from the user apart from clicking 'continue' or 'OK'.
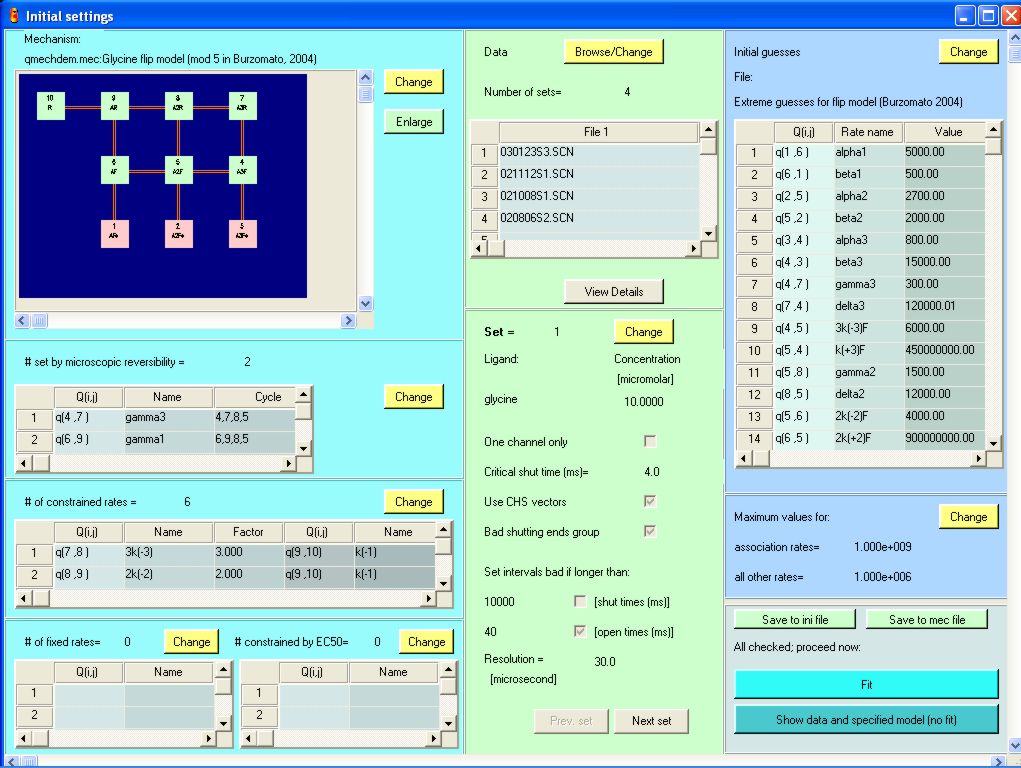
This page summarises most of the information that is needed before you can start a fit. For the demonstrations it will appear filled in correctly so all you need to do is click 'Fit'. This example shows the settings for a simultaneous fit to glycine receptor single channel recordings at four glycine concentrations (Burzomato et al. 2004).
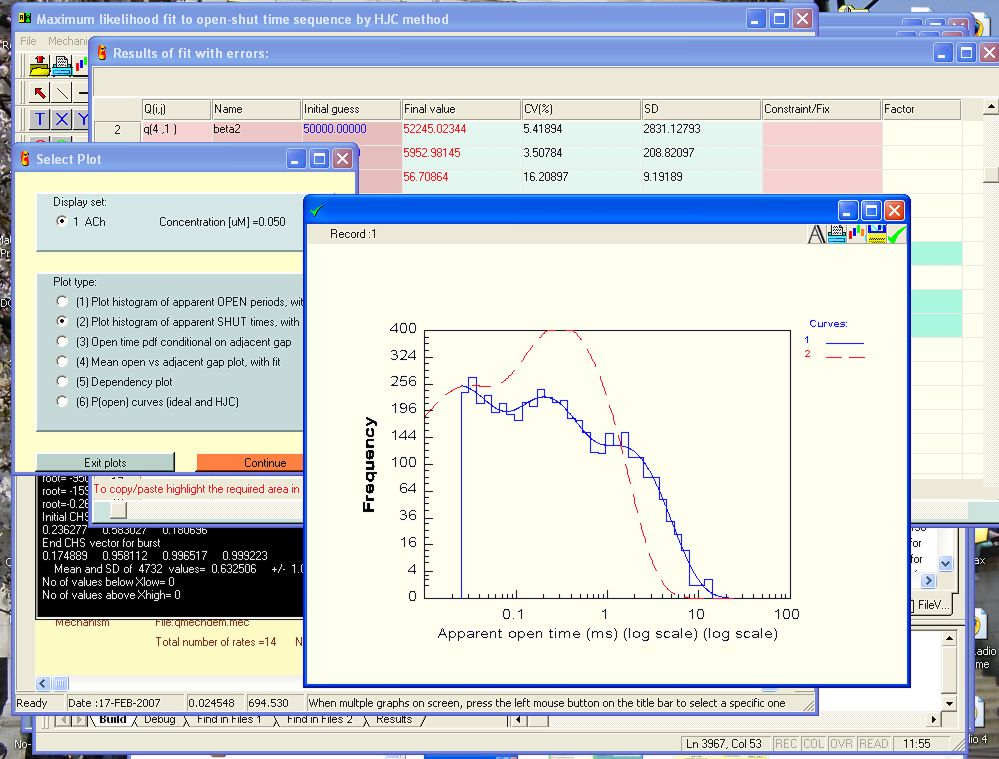
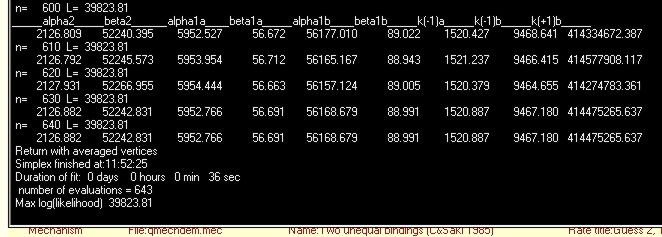
At the end of the nicotinic receptor demonstration fit we see that it took 36 seconds
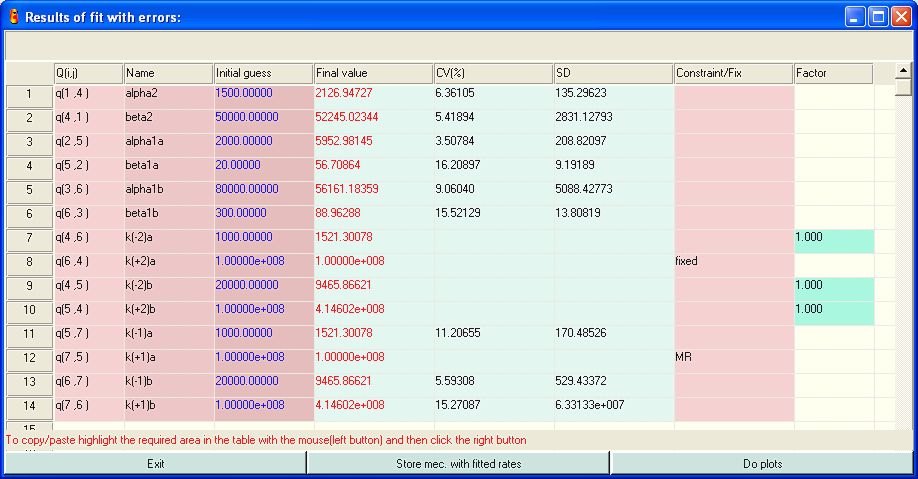
After calculation of errors, the values for the rate constant estimates are displayed.
Then the quality of the fit can be judged by displaying six types of graph. The distribution of the apparent open times is shown in the histogram. The blue line superimposed on (not fitted to) the histogram shows the HJC distribution of apparent open times that is predicted by the fit. The fact that it describes the observations well shows that the mechanism used is adequate to describe the data. The red dashed line shows the predicted 'true' distribution of open times, calculated from the fitted rate constants with no missed event correction (by the simpler methods of Colquhoun & Hawkes, 1982).