 Close
Close

Opinion: Why counting coronavirus deaths is not an exact science
20 April 2020
Statisticians Professor Gianluca Baio (UCL Statistical Science) and Professor Marta Blangiardo (Imperial College London) explain why it’s hard to calculate the actual number of deaths due to Covid-19 and the steps that need taking to make sense of what is happening.

Nothing can be said to be certain, except death and taxes.” Right? Well, not quite. As many people are discovering during the Covid-19 crisis, even something as seemingly straightforward as the count of people who have died might not be as robust as to be taken at face value. In the UK, distinctions between the data from the Department of Health and Social Care (DHSC) and the Office for National Statistics (ONS) have led to talk of whether deaths are being underestimated and even whether the figures can be trusted.
The pandemic highlights several difficulties in counting, reporting and modelling mortality data. Arguably, the most important problem is the “denominator” – what is the actual number of people who are infected by the virus? This is virtually impossible to determine, except perhaps in the unlikely scenario of real-time, continuous, population-wide testing. The absence of this figure creates problems when rescaling the outcomes – for example, deaths – to the number of people at risk, which is not known with precision. And because we cannot know for certain the total number of infected, international comparisons also become tricky: does Germany have more cases than the UK because it tests more and reports the results more systematically?
Even within a single country, testing and its reporting may not be as clear-cut as we would like it to be. For instance, the UK government strategy for testing is based on “five pillars”, the first two of which relate to testing done in the NHS and testing carried out by commercial partners. The latter figure, however, is not available for reporting and so the official data on the number of positive individuals only uses the former.
Another interesting dimension that makes international comparisons tricky is the set of often unknown or unobserved factors that are likely to determine the underlying infection dynamics. One obvious characteristic is the population age structure: some comparisons using official data on age profile (typically from a census, so only representing a snapshot at a given time) show that Belgium had 512 deaths per million population among those over 80 years of age, while England and France had smaller and comparable figures of 219 and 232 deaths per million respectively in that age group (as of 31 March for Belgium and France, and 2 April for England). But other, more subtle features may play a fundamental role. For instance, there is evidence to suggest a strong association between air pollution and Covid-19-related mortality. This may explain why heavily polluted areas such as Lombardy in Italy have been badly affected by the virus.
But even when focusing on absolute mortality (that is, the number of deaths, for instance, in a specific location at a given time) there are issues, and figures may appear inconsistent. Broadly speaking, in the UK there are two main sources of data: the DHSC and the ONS; in reality, the data for both comes from an even more composite pool of sources. For example, the DHSC combines figures from the four devolved administrations, and these are not fully harmonised – the England and Wales counts are done at 5pm the day before they are published, while Scotland stops the clock at 9am and the Northern Ireland count is at the unconventional cut-off of 9.15am.
One crucial difference between the two meta sources is the temporal resolution: the DHSC provides daily updates, while from 31 March the ONS has been reporting weekly data. Thus the DHSC data is instrumental in estimating the underlying mortality trends. ONS data can be used only to make week-on-week comparisons.
On the other hand, there are two major limitations in the way the DHSC data is collected: it records hospital deaths among confirmed cases of Covid-19. For England, this excludes deaths outside hospitals, which is increasingly of concern, given the potential for large numbers of Covid-19-related deaths in care homes. And unconfirmed cases are excluded – these may be deaths, even in hospitals, where the individuals had not been tested prior to death.
As for the ONS, it reports weekly data based on all deaths registered involving Covid-19 according to death certification, whether in or out of hospital, for England and Wales. In this sense, the figures represent a gold standard as they are likely to include more deaths due to Covid-19. But the ONS only includes England and Wales so direct comparison is possible only in a limited geographical area in the country.
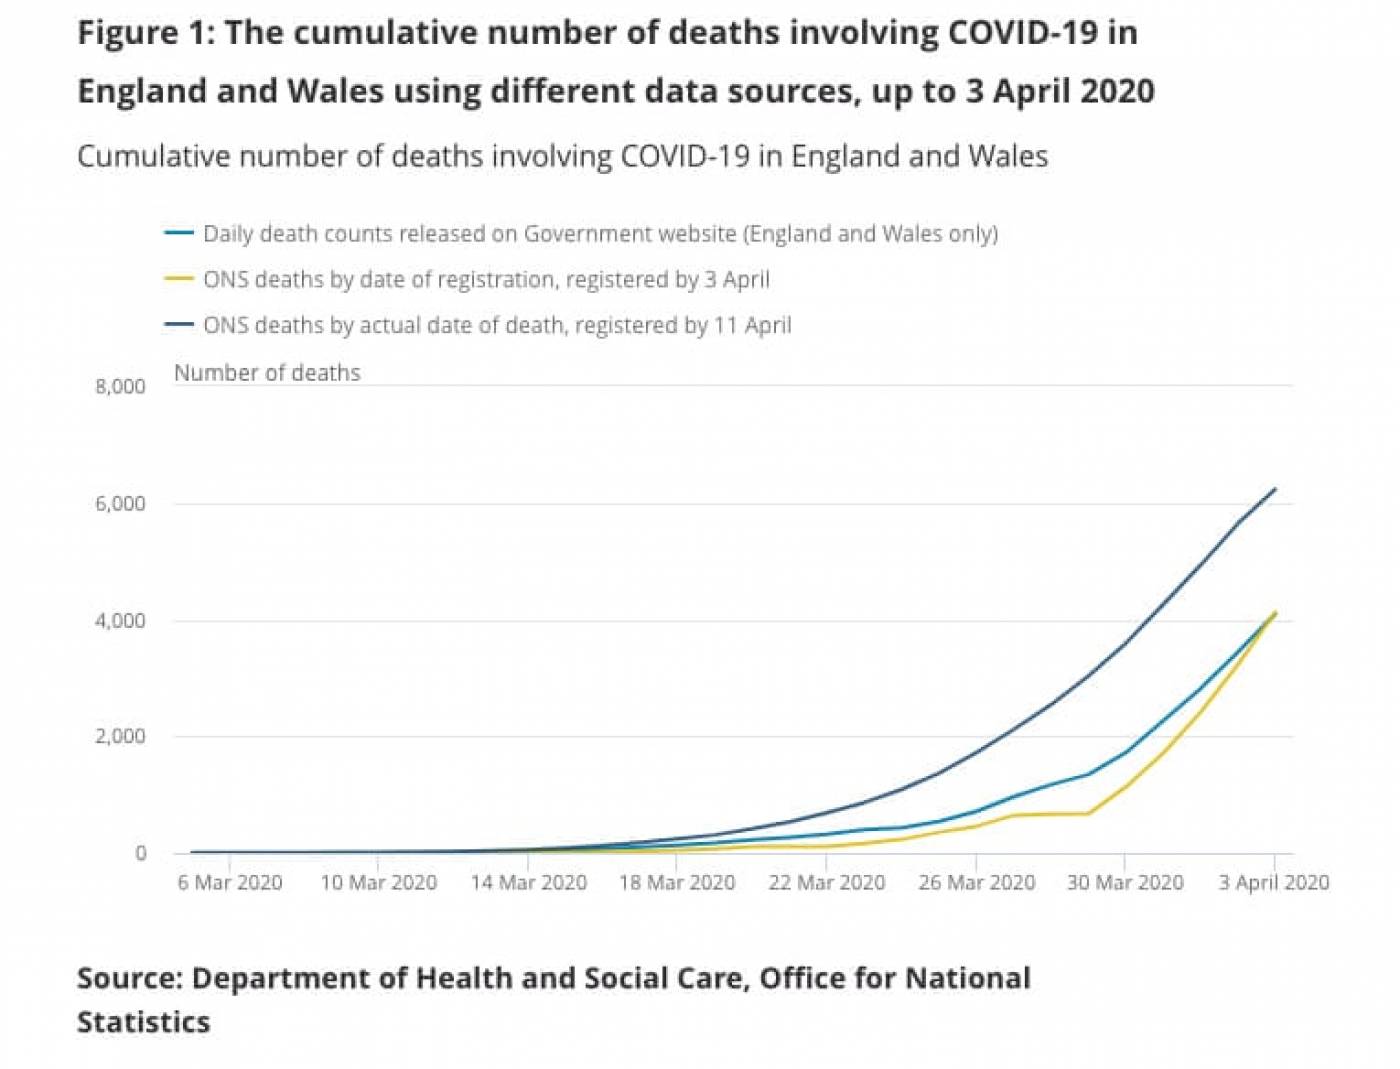
The graph above shows the potential differences in the data, comparing the DHSC figures to two “data cuts” from the ONS. There is a staggering difference in the number of deaths as at 3 April when comparing the data registered by 11 April (6,235), which exceeds the DHSC figure by 2,142. This is due to differences in the recording of data in the two sources: ONS figures are based on the date of death, while the DHSC refers to the date of notification.
So what is the actual number of deaths due to Covid-19? It is probably too soon to give a definitive answer. At this time, it is important to acknowledge uncertainty in the figures and allow for the timely integration of different sources of information through suitable modelling and consistent extrapolation on which the scientific community can reach some consensus, before we can make more sense of what is happening.
This article was originally published in the Guardian on 19 April.
Links
- Professor Gianluca Baio’s academic profile
- UCL Statistical Science
- UCL Mathematical & Physical Sciences
Follow us