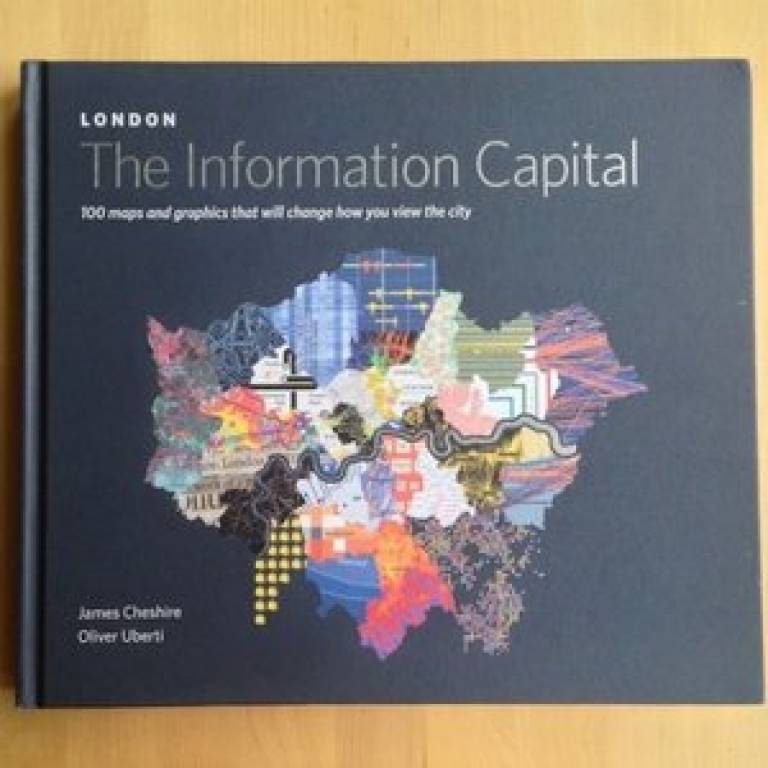
'London: the Information Capital' showcases UCL data and mapping research
5 November 2014
A new book bursting with London maps and infographics, published last week, is the result of a year of intense work by Dr James Cheshire (UCL Geography) and designer Oliver Uberti.

'London: the Information Capital' seeks to paint a contemporary portrait of the city through its abundance of open data and highlights a range of UCL research from departments including the UCL Centre for Advanced Spatial Analysis (CASA) and UCL Security and Crime Science.
Work from UCL researchers featured in the book includes the capture of commuter flows from Oyster Card data, a new map of the demographic composition of the capital and fresh insights into huge volumes of social media data.
The book contains over 100 full-colour spreads alongside essays introducing each of five broad themes - Where we are, Who we are, Where we go, How we're doing and What we like.
Many of the graphics are the direct result of research that I'm working on or the results from research by friends and UCL colleagues. Whilst working on the book I would keep asking myself 'If I could map anything on London what would it be?'
Dr James Cheshire
Talking about the idea behind the book, James said: "More datasets are freely available for London than ever before and our ability to make the most of them thanks to powerful computers and graphics software has never been better. Such developments, combined with the inspiring work of colleagues at UCL, meant it felt like the ideal moment to capture the depth and diversity of modern London through its data."
Facts from the book include:
- The trains of the London Underground network log more than 75 million kilometres a year - like circling the Earth at the Equator 1,900 times.
- In one corner of the City of London, the population spikes from 222 residents by night to in excess of 127,000 by day.
- In 2013, the London emergency services responded to 1.1 million calls. 32,500 of them were for incapacitated binge-drinkers.
- In 2013, Londoners took 2.4 billion bus journeys.
- How "The Knowledge" of London's black cab drivers compares to sat nav.
James added: "We hope that the book works on a number of levels. Each of the hundred or so graphics has its own message about a particular aspect of London life as shown through its data. When combined these graphics offer a compelling argument for the power of data visualisation and the importance of London as the information capital.
"Many of the graphics are the direct result of research that I'm working on or the results from research by friends and UCL colleagues. Whilst working on the book I would keep asking myself 'If I could map anything on London what would it be?' and then try and pursue the answer. Some data had never been collected, but many times datasets were already freely available through the likes of the London DataStore or could be obtained through Freedom of Information requests."
James' current research focus is the use of 'big data' and open datasets for the study of social science - a project funded by the ESRC Future Research Leaders Scheme. James is also a co-investigator in two of ESRC's 'Big Data Network' initiatives - the Consumer Data Research Centre and the Administrative Data Research Centre. He has published in a range of journals on a variety of topics including the use of cycle hire schemes, the spatial analysis of surnames and new ways to visualise population data.
Links
Images
(Top right) 'London: the Information Capital'
 Close
Close

