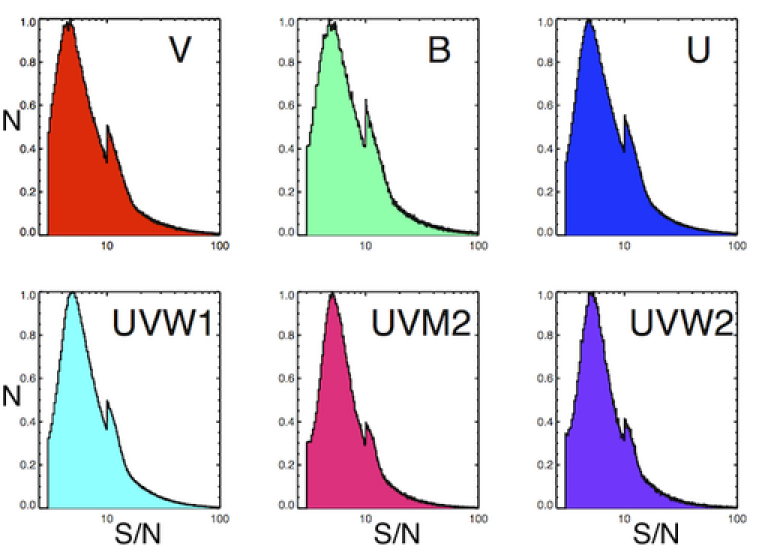
The XMM-OM SUSS2 catalogue contains 5,893,047 source detections above a signal-to-noise threshold limit of 3-σ which relate to 4,008,879 unique objects of which 692,223 have multiple entries in the source table, corresponding to different observations. Fig. 1 plots histograms of the detection significance distribution of all the good-quality sources contained within the catalogue, separated by filter. The discontinuous low-significance cut-off is artificial and the result of rejecting potential source detections at significance levels < 3σ. The discontinuity observed at 10σ occurs because sources below this value undergo a secondary significance calculation using a smaller circular source aperture of radius 2.8 arcsec. The significances for sources above this value are calculated with aperture radii of 5.6 arcsec. Sources with a quality flag > 0, in any filter, are not included in fig 1.

Figure 1: The normalized detection significance distributions of sources contained within the XMM-SUSS2 catalogue, plotted on a log scale. N is the number sources per significance bin, normalised to a peak of 1.0.
The dichotomy seen between UV and optical distributions in the first version of the catalogue (see Figure 1 of XMM-OM-SUSS) is no longer seen because the observations are now included whether or not they have a UV detection. Number counts for source detections through each filter are provided in Table 1. XMM-Newton is primarily an X-ray observatory and many of its science programs contain no optical or UV aspect beyond the serendipitous detection of field sources. Thus the number of detections is roughly proportional to the effective areas of the filters, however, UVW1 and U are the often the default filters during pointings because they optimize throughput with scientific impact, and the distribution of sources in Table 1 reflects that.
| Filter | Ndet(>3σ) | Nsrc(>3σ) | fobs(%) |
| V | 1,589,763 | 1,109,225 | 20.2 |
| B | 894,346 | 660,592 | 12.0 |
| U | 1,603,082 | 1,205,083 | 22.0 |
| UVW1 | 2,653,194 | 1,971,815 | 36.0 |
| UVM2 | 486,524 | 354,723 | 6.5 |
| UVW2 | 279,365 | 182,042 | 3.3 |
| total | 7,506,274 | 5,483,480 | 100 |
Table 1: Detection statistics for each of the six XMM-OM lenticular filters included within the XMM-SUSS2 catalogue. Ndet is the number of source detections, Nsrc is the number of unique sources after accounting for multiple detections over different pointings. fobsis the fraction of total sources detected through the filter.
 Close
Close

