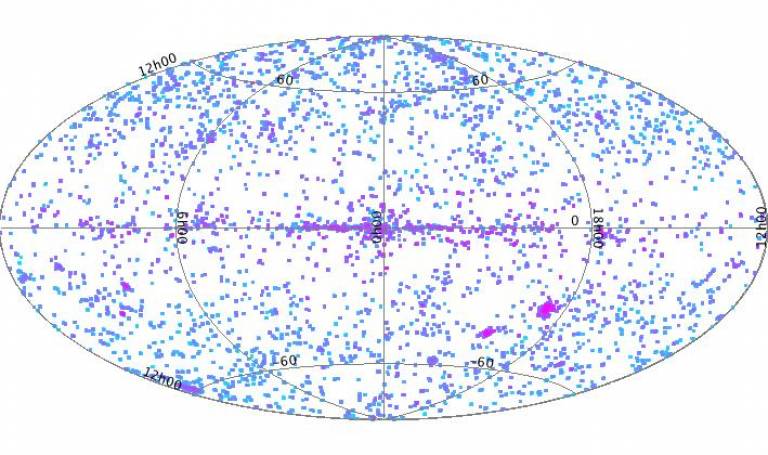
Figure 1 plots the distribution of XMM-OM pointings included in the catalogue. The size of the pointing symbols are not related to field-of-view but vary in hue as the detected source density increases.
Mirroring the wide variety of scientific experiments performed by XMM for it's Guest Observers, there are sub-clusters of pointings around the Galactic plane, concentrated towards the Galactic center, and the Magellanic Clouds. Between the Galactic plane and poles the pointings have a more random distribution (in a serendipitous sense) for extra-Galactic and Galactic-neighbourhood targets. The second extension of the FITS file housing the SUSS2 catalogue (SUMMARY extension) includes information about pointing.

Fig 1: The observation content of the SUSS2 catalogue mapped onto the sky in Galactic longitude and latitude.
The following table contains an approximate measure of the total area of sky observed through each filter, assuming an average window size of 10'x10'. fobs is the fraction of observations which contain a specific filter. N src is the number of sources found with a detection significance > 3σ.
| Filter | Sky Coverage (deg2) | Nsrc (> 3σ) | fobs (%) |
| V | 21 | 1,109,225 | 18 |
| B | 20 | 660,592 | 16 |
| U | 105 | 1,205,083 | 93 |
| UVW1 | 75 | 1,971,815 | 63 |
| UVM2 | 59 | 354,723 | 49 |
| UVW2 | 36 | 182,042 | 31 |
Table 1: Sky coverage statistics for each of the six XMM-OM lenticular filters included within the catalogue.
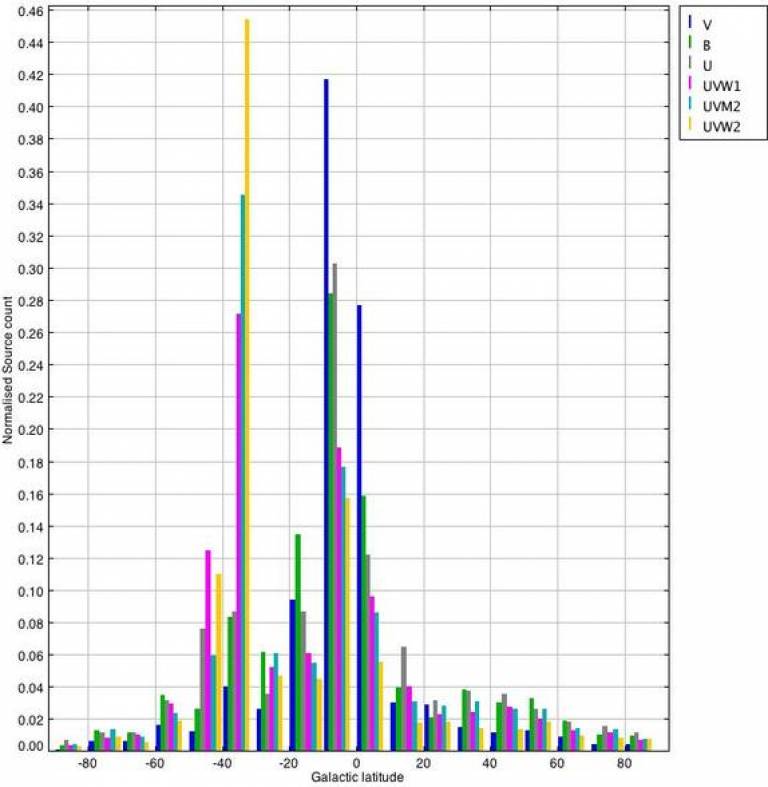
Plotting in Figure 2 the distribution of sources as a function of Galactic latitude reveals several clusters, one associated with the Galactic plane at b = 0° and the other at b = -30° associated with the Magellanic Clouds.

 Close
Close

