Any quality issue at the position of a source is assigned to the source as a flag and listed in the final columns of the SOURCES table. Each flag is a binary number whose bits correspond to the presence of an image artefact (see Table 1) . A table of statistics is given below
| Bit number | Reason | Integer Value |
| 0 | Cosmetic defects (BAD PIXELS) within the source region | 1 |
| 1 | Source on a READOUT STREAK | 2 |
| 2 | Source on a “SMOKE RING” | 4 |
| 3 | Source on a DIFFRACTION SPIKE | 8 |
| 4 | Source affected by MOD-8 noise pattern | 16 |
| 5 | Source within a “HALO RING” | 32 |
| 6 | Source near to a BRIGHT source | 64 |
| 7 | MULTIPLE EXPOSURE values within photometry aperture | 128 |
| 8 | Source within an EXTENDED FEATURE | 256 |
Table 1: Quality flag values for the UVOTSSC source catalogue.
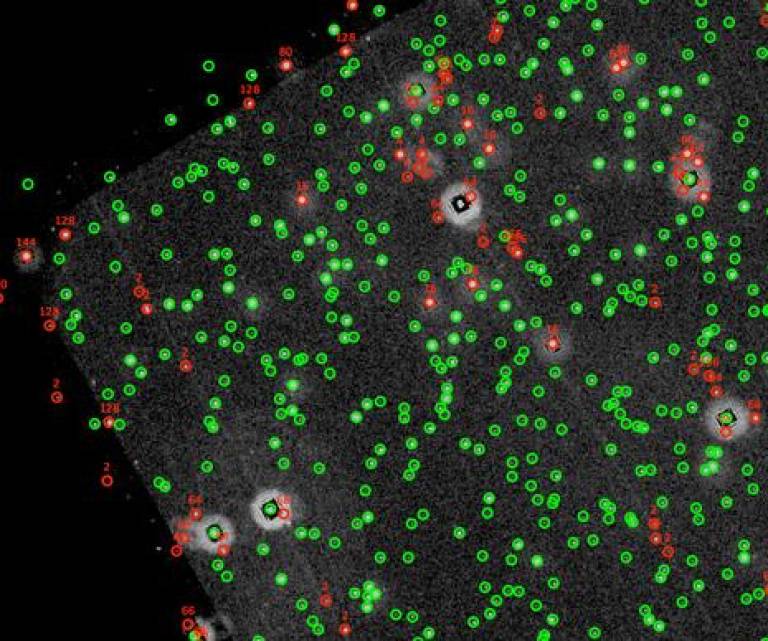
An example image is shown below with detected sources identified: green for sources with no quality flag set, red for sources with a quality flag set. The number indicates the flag. Table 1 gives the meanings of the flags. Multiple flags are summed to give the final quality flag value.
e.g. If source contains one or more bad pixels (value 1) and lies on a read-out streak (value 2), the final quality flag value will be 3.
Note that since the sources are detected on summed images, (after stacking the raw images in an ObsID), it is possible to have a flag assigned to the source that is not relevant to all of the images in the stack.
For the numbers of flags set, please see Table 2. For more examples see Quality Flagging in the Processing section.

Figure 1: Sources in a B filter image: the red circles identify the sources with a quality flag. The identity of the flag (or flags) is given by a number, which may be a sum of several flags.
| V | B | U | UVW1 | UVM2 | UVW2 | |
| no flags set | 84.8 | 86.3 | 88.2 | 90.0 | 85.0 | 88.4 |
| 0 | 0 | 0 | 0 | 0 | 0 | 0 |
| 1 | 7.5 | 3.4 | 4.0 | 3.0 | 3.7 | 2.4 |
| 2 | 0.9 | 1.8 | 0.4 | 0.5 | 0.8 | 0.4 |
| 3 | 1.8 | 0.4 | 0.6 | 0.08 | 0.03 | 0.02 |
| 4 | 1.0 | 1.8 | 0.9 | 0.3 | 0.05 | 0.08 |
| 5 | 0.2 | 0.07 | 0.2 | 0.3 | 0.1 | 0.2 |
| 6 | 2.3 | 4.7 | 2.4 | 0.8 | 1.4 | 0.8 |
| 7 | 3.5 | 3.1 | 3.2 | 3.6 | 7.1 | 4.2 |
| 8 | 0.7 | 1.0 | 1.7 | 2.9 | 3.7 | 4.6 |
Table 2 gives the statistics (in percentages) of sources bearing flags in the UVOTSSC source catalogue. Note that the columns do not add up to 100% because some sources have more than one flag set.
 Close
Close

