In the following sections the UVOTSSC we review the contents of the catalogue and properties of the catalogue sources.
- Filter Set
The effective areas for the six UVOT broadband filters (including the white filter that is not used in the UVOTSSC catalogue) are shown in Figure 1. The three optical filters (U,B and V) are similar, but not identical to the Johnson UBV set. Table 1 gives parameters describing the filters as well as the zero points used in the making of the catalogue.
Figure 1: the UVOT effective area curves for all broadband filters.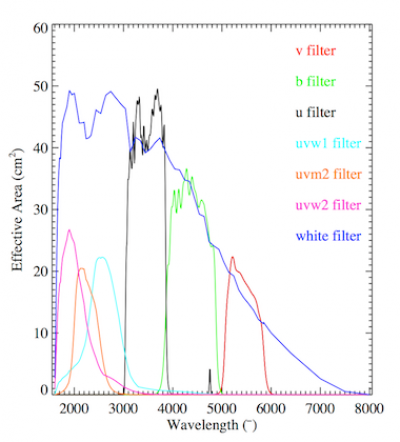
Filter Central wavelength (A) FWHM (A) Zeropoint (Vega) Zeropoint (AB) FWHM of PSF (arcsec) V 5468 769 17.89 ± 0.01 17.88 ± 0.01 2.18 B 4392 975 19.11 ± 0.02 18.98 ± 0.02 2.19 U 3465 785 18.34 ± 0.02 19.36 ± 0.02 2.37 UVW1 2600 693 17.44 ± 0.03 18.95 ± 0.03 2.37 UVM2 2246 498 16.85 ± 0.03 18.54 ± 0.03 2.45 UVW2 1928 657 17.38 ± 0.03 19.11 ± 0.03 2.92 Table 1: These are the zero points used in the making of UVOTSSC. Other columns are listed here for convenience. The information is given in the CALDB and calibration documents. The central wavelength is the mid-point between the wavelengths at half-maximum.
Comparing the filters with those of XMM-OM
Figure 2 has the XMM-OM effective area filter curves for direct comparison with Figure 1.
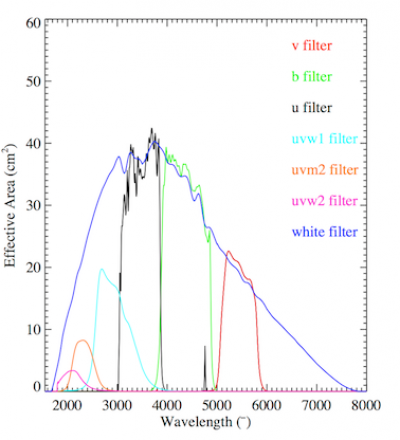
Figure 2. XMM-OM effective area curves
The V, B, U, UVM2 and UVW2 filters in UVOT and OM are very similar in shape if not in throughput, however the UVW1 filters were not manufactured together and cover different wavelengths, as shown in Figure 3.
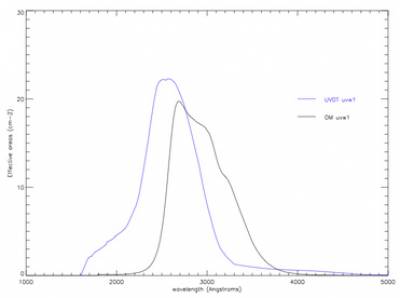
Figure 3: The effective areas of the UVW1 filters: Black XMM-OM, Blue Swift-UVOT.
CALDB and calibration documents
- Source Detections
From the 23 059 observations we get 13 860 569 catalogue entries, out of which 6 200 016 unique sources are identified, whereas 2 027 265 sources have multiple entries. Statistics on the source detections by filter are given in the table below. See the time sampling section for more information on the properties of the sources with multiple entries.
V B U UVW1 UVM2 UVW2 Total detections 5101745 3350379 4942908 3834623 1799240 3111707 No. of sources 2203754 1582460 2517331 1876420 1074469 1586881 No. of multiples 855915 551812 708745 536598 238708 398922 % repeats 38.8 34.9 28.2 28.6 22.2 25.1 Mean AB magnitude 17.81 18.37 19.65 20.62 21.16 21.38 Mean mag error 0.08 0.09 0.09 0.10 0.13 0.11 Brightest AB mag 11.40 12.83 13.18 12.80 12.06 12.63 Faintest AB mag 23.82 24.18 25.09 25.86 25.70 26.00 Table 1: Some statistics on the numbers of sources included in the catalogue for each filter. "No. of multiples" means the number of sources with more than one entry. The bright end limit corresponds to the limit at which coincidence loss can no longer be corrected.
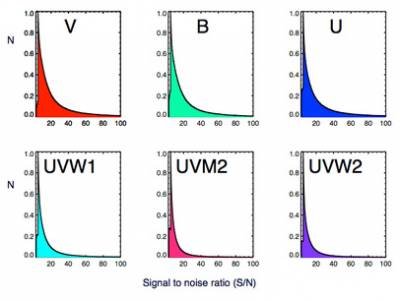
Figure 1: The normalised detection significance distributions of sources in the UVOTSSC catalogue. N is the number of sources per significance bin, normalised to a peak of 1.0. There are no sources with a S/N of less than 3.0. The discontinuity at S/N=5 is due to the fact that no sources are included unless at least one of the filters has a detection of S/N=5 or more.
- Astrometry Assessment
The astrometry correction process is described in Data Processing:Astrometry section, where we describe how the astrometric correction uses the USNO-B1.0 catalogue. Here we evaluate the accuracy obtained in the catalogue.
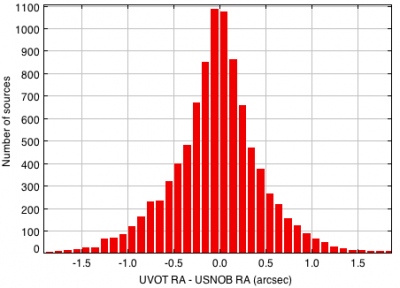
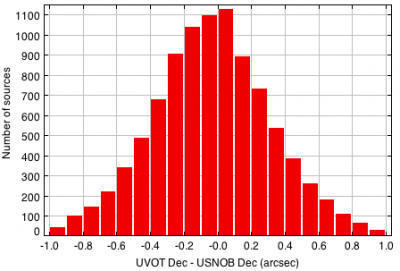
Two columns, RA_ERR and DEC_ERR give the statistical error on the position in arcsec. 98% of the sources have statistical uncertainties on the position of less than 0.5 arcsec. We have compared the source positions given in the catalogue versus those measured by USNO-B1.0 for part of the catalogue (between 0 and 1 hour in RA). The mean distances between UVOT and USNO-B1.0 positions in RA is 0.0002 with a 1 sigma range of +/-0.7 arcsec, and in Dec is -0.033 +/- 0.3 arcsec, as shown in the histograms below. The overall separation between the UVOT positions and those of USNO-B1.0 is 0.42 +/- 0.23 arcsec, which is comparable with the statistical error.
The distance in RA (left) and Dec (right) between the source positions as recorded in the catalogue versus those in USNO-B1.0.
- Sky Coverage
The second SUMMARY extension of the UVOTSSC includes the pointing information for each ObsID. Figure 1 plots the distribution of Swift-UVOT pointings included in the catalogue. The fairly random sky coverage is due to the fact that GRBs positions are isotropic in the sky as they come from outside our galaxy. Nevertheless there is a concentration of pointings towards the galactic plane, reflecting the positions of objects of interest chosen by Guest Observers.
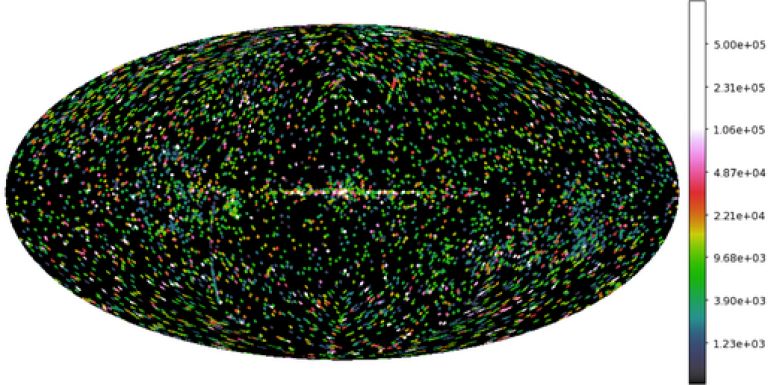
Figure 1: This shows the sky coverage of the UVOT data in the catalogue, in galactic coordinates.
The following table contains an estimate of the total sky area observed through each filter and included in the catalogue. This is calculated using the unique pointing directions; there is no correction made for overlaps. The percent_obs column is the fraction of all the observations which contain a specific filter. It is clear that there is an emphasis on using the UV filters where possible because these give the unique science.
Filter Sky area (deg2) percent_obs V 176.7 34 B 163.6 29 U 282.6 45 UVW1 297.9 51 UVM2 284.8 43 UVW2 299.7 50 Table 1: Sky coverage statistics for each of the six UVOTSSC filters included in the catalogue.
- Time Sampling
The Swift-UVOT revisits sources on several different timescales.
As described in the Data Processing page the Swift observing time is broken up into 'snapshots' of 5 to 45 minutes each. A set of snapshots make up an observation 'segment'. Within the segment therefore there may be several exposures taken with the same filter on a short timescale. For the catalogue these have been summed together so any variability on this timescale is lost. However the same source may be visited again for many reasons (e.g. an observing campaign for a GRB or another variable source in the field of view), or serendipitously. 2 027 265 sources have detected in multiple observations and Figure 1 shows the number of entries.
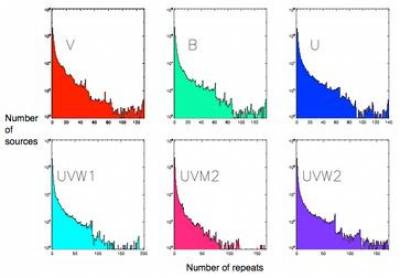
Figure 1: Histograms showing the range and number of multiple entries for each filter in the UVOTSSC.
The dates at the start of each observation are recorded in the second catalogue table (the SUMMARY table). Taking 65000 of the sources identified as having more than one entry (i.e. multiple observations) in the first table of the catalogue, the time intervals between the observations are plotted in Figure 2. This plot does not distinguish between the filters but shows short time intervals are the most common with the longer and longer time intervals getting steadily less common (as expected). The longest possible interval would be ~2000 days; the number of days between the first observation in the catalogue and the last.
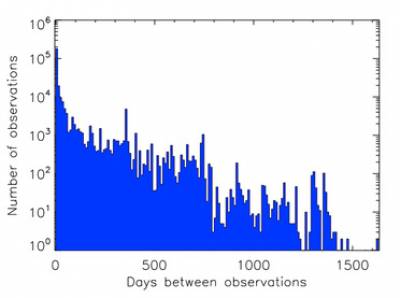
Figure 2: Histogram of time intervals between repeated observations of the same source
Variable sources
It is possible to estimate how many of the sources are variable by comparing the variability in the count rates with the expected errors. For this only sources observed four or more times were included. A source is considered to be variable if the standard deviation in the measurements is more than three times the mean (1 sigma) error, see Table 1. The number of sources found in this way to be variable in at least two UV filters is 38,769, and all three UV filters is 5,957.
Filter No. sources observed more than 3 times No. variable sources Percent UVW1 296001 72432 24 UVM2 143888 29974 21 UVW2 215680 56444 26
Table 1: showing the number of possibly variable sources in UVOTSSC in the UV filters- Photometry
The AB magnitude ranges and mean magnitudes for each filter are given in the following table and Figure 1. The UV filters are able to detect fainter sources because of the lower sky background level. The errors on the magnitudes given in the catalogue are shown in figure 2.
V B U UVW1 UVM2 UVW2 Mean AB mag 17.94 18.54 19.80 20.75 21.32 21.53 Faint AB mag limit 23.82 24.18 25.09 25.86 25.70 26.00 Bright AB mag limit 11.40 12.83 13.18 12.80 12.06 12.63 Table illustrating the range of AB magnitudes of the sources detected in each filter.
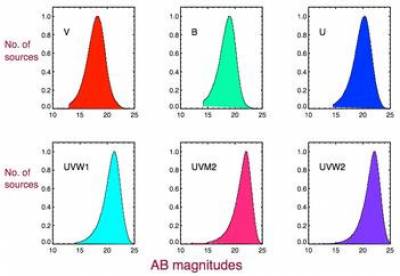
Figure 1: Histograms for all filters illustrating the range of source AB magnitudes.
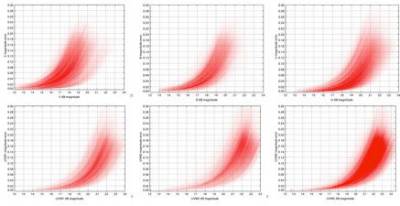
Figure 2: Magnitude errors against AB magnitudes for all filters.
Comparing the statistical errors with observed variance
As so many of the sources are observed more than once it is possible to assess the photometric error by measuring the variation in magnitude for the same source in repeated observations. Figure 3 shows again the statistical errors plotted in figure 2 but this time over plotted with the 1 sigma variance between observations. No attempt has been made to remove genuinely variable sources, but it would appear that the variation between repeated observations is sometimes greater than would be expected by the statistical error.
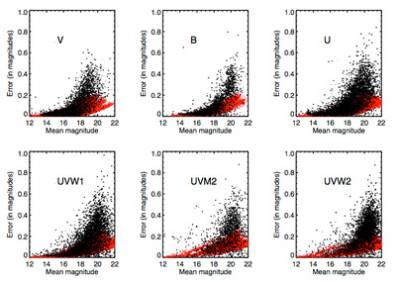
Figure 3: Comparing statistical magnitude error (red) with the variation in magnitude between repeated observations (black).
Comparing measured magnitudes with those from the XMM-SUSS2 catalogue
Since the filters in XMM-OM and Swift-UVOT are similar, it is useful to compare the photometry from the two instruments. A cross correlation between the UVOTSSC catalogue and the XMM-SUSS2 catalogue allows us to compare the magnitudes. Figure 4 left plot shows the comparison for the optical filters and in the right plot the UV filters.
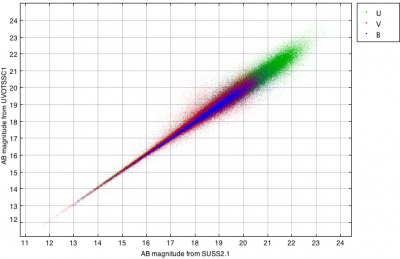
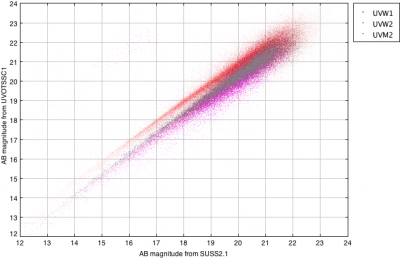
For most of the filters the magnitudes measured by the OM in XMM-SUSS2.1 and the UVOT in UVOTSSC1 agree well, so the comparison shows one-to-one correspondence. The odd one out is the UVW1 filter, which displays a bimodal distribution with a systematic offset by 0.5 to 1 magnitudes for some sources. This is because this filter is the only one which has a significantly different shape in the OM from the UVOT (see the filter section). Hot sources measured in the UVW1 filter DO line up one-to-one line, but cooler sources are offset, as shown in Figure 5. Figure 4 left: Optical magnitudes from sources matched between the XMM-SUSS2.1 catalogue and this UVOTSSC1 catalogue. Right: UV magnitudes.
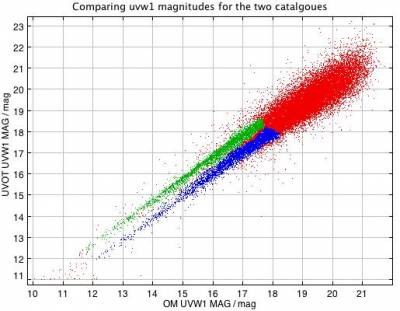
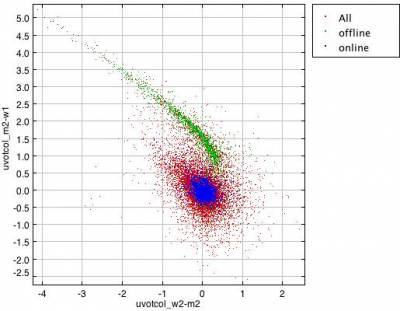
Filter set including comparison with XMM-OM The XMM-SUSS2.1 catalogue More on the effect of spectral types and coloursFigure 5. Left: UVW1 magnitudes taken from the UVOTSSC catalogue plotted against the XMM-SUSS2 catalogue and showing a bimodal distribution. Right: A UV colour-colour diagram using the same data showing the two populations are distinctly divided by colour: the blue magnitudes are from hotter sources.
- Colours
For catalogued sources detected in three or more colours we can produce colour-colour distributions. A family of spectral models and standard sources, with no Galactic extinction or redshifts applied, have been folded through the UVOT filter bandpasses. The two examples presented in Figure 1 display the U−B - B−V plane and the UVW2−UVM2 - UVM2−UVW1 plane, both with relatively distinctive features. No attempt has been made to de-redden or k-correct the colours. The top of the figure shows the colours obtained using simulated (Pickles, 1998) spectra; standard stars of spectral types ranging from M6 to O5 and luminosity types ranging from I to V. The spectral type is given as a label for each point. At the bottom we show the equivalent plots made using sources in the catalogue. (These are density plots so the colours indicate the number of sources rather than the spectral types.) The catalogue plots follow the shape of the simulations closely.
In optical colours, the distribution of this sample is easily understood with stars revealing ever-bluer colours, right-to-left and top-to-bottom as we travel from cool M to hot O stars. The UV colours reveal a different trend in the cool stars however, stars initially become redder as we travel from M stars to hotter types before turning a corner at approximately solar spectral types. This cool-star behaviour result from a combination of negligible UV flux and the wings of the UV transmission curves extending into the optical bands.
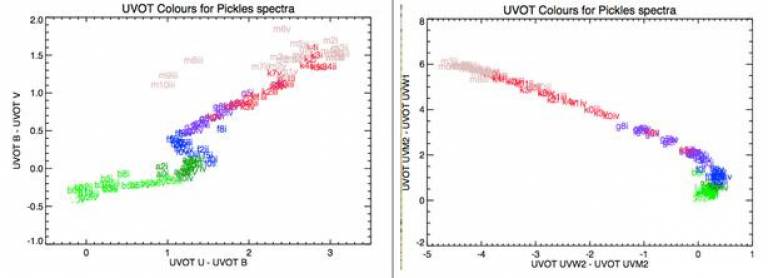
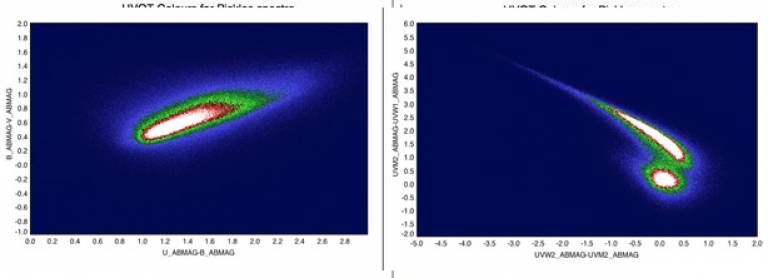
Figure 1: Top: Simulated colour-colour diagrams for the UVOT, using Pickles (1998) star spectra. Bottom: Colour-colour diagrams using UVOTSSC.
Comparing with the XMM-OM colours
Using the Pickles spectra we can simulate the difference in response between the XMM-OM filters and those of Swift-UVOT. Figure 2 compares the magnitudes for the two instruments for the set of Pickles spectra. For most of the filters there is a one to one correspondence, but for uvw1 and uvw2 it can be seen that they curve away from the straight line as the stars become redder. This is due to the effective areas for these filters being different in the two instruments, as shown on the filter set page, and also illustrated in the photometry page.
Figure 2: The Swift-UVOT magnitudes compared with the XMM-OM magnitudes simulated using the Pickes star spectra. The filters are described with different symbols. The spectra are labelled for the uvm2 filter using coloured letters.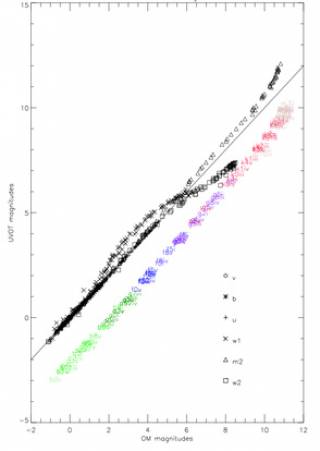
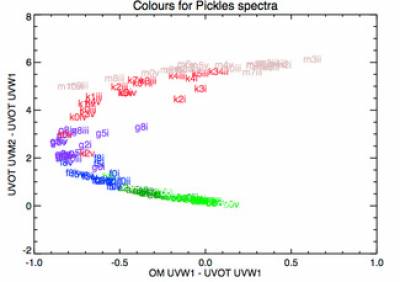
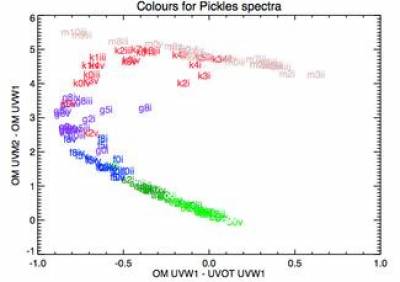
Figure 3: Color-colour diagrams comparing the XMM-OM and Swift-UVOT colours.
- Extended Sources
The aperture for extended source photometry is source-dependent and irregular, containing all pixels associated with the object during the source detection operations. All clustered pixels > 2σ above the background are considered to be the same source. The raw pixel background level is obtained from the global background map, the same as that used during source detection.
Coincidence loss corrections for extended sources have an unknown systematic error because event centroids have a different and empirically-unquantifiable distribution compared to point sources. Coincidence losses are calculated for each individual pixel using a 5 arcsec aperture centred on the pixel. Both source pixels and background are corrected, and the source count rate is the summation of all corrected pixels within the source aperture minus the inferred summation of corrected background within the aperture.
Both zeropoints and flux conversion factors for extended sources are identical to those used for point sources. The magnitudes and fluxes quoted in the catalogue are integrated over the whole aperture, rather than provided per unit area.
- Source Redshifts
It is possible to get a photometric redshift from the UVOT if the source is observed in all filters for long enough. This is because as the redshift increases, the position of the Lyman break in the spectrum moves to longer wavelengths. At wavelengths below the Lyman Break we do not expect to get any detection of the source. Thus, as the redshift increases we lose detections in the filters in the order UVW2, UVM2, UVW1, U, B, V. Table 1 shows the redshift associated with the source being detected only in that filter and those above, e.g. if the source is only detected in the V filter, the redshift may be 5.
Unfortunately it is not possible to use the catalogue to find source redshifts as yet because although upper limits are given for each filter for each observation in the SUMMARY table, these numbers are measured for each image as a whole, and there is no indication of whether the source of interest was actually in the field of view in this filter, or was maybe just outside the FOV (see source detection). We hope to make this distinction in the next version of the catalogue.
Filter Mid Wavelength (nm) Z V 546 5 (4.5-5.6) B 435 3.7 (3.1-4.5) U 345 2.8 (2.4-3.3) UVW1 260 1.9 (1.2-2.8) UVM2 220 1.4 (1.0-3.0) UVW2 193 1.2 (0.8-7.2) Table 1: showing the redshift associated with a source being detected only at wavelengths longer than a particular filter.
 Close
Close

