Basics
- Introduction to Flow Cytometry
Flow cytometry (FCM - also known as FACS, which is a registered trademark of Becton Dickinson and stands for Fluorescence activated cell sorting) uses sophisticated technology that makes use of the principles of light scattering by particles crossing a beam of light, and excitation and fluorescence emission of fluorochromes attached to specific molecules or expressed by cells, to identify, analyse, and/or sort different populations of cells.
The process begins with a population of single cells, or particles, suspended in a medium, injected into a stable stream that forces cells to travel one by one to be interrogated by the flow cytometer.
Each particle passes through one or more beams of laser light. Scattered light and fluorescence emission provide information about the particle's properties. Information is gathered from the manner in which a particle scatters light or by the light emitted by fluorochromes attached to, or contained in, the particle.
Light scattered in the forward direction of a laser beam is focused by a confocal lens and detected by a light detector which converts it into an electrical signal that is digitalised to generate a parameter known as Forward Scatter (FSC). The FSC signal will give information about the size and shape of the cell, and information can also be gathered by a side confocal lens and detected by a detector reading side scattered light. The Side Scatter (SSC) signal gives information about the granularity of the cell. As FSC and SSC are unique for each type of particle, the combination of the two can help identify different types of cells.
Several optical detectors called photomultiplier tubes (PMT) are used in a flow cytometer to read fluorescence. These read the light emitted from the particle crossing the laser beams that excite the attached fluorochromes. Different fluorochromes will emit light at different wavelengths and these are split into specific colours by optical filters and sent to PMTs. PMTs convert light into an electrical pulse that is digitalised by other converters into signals readable by a computer as events, which are then used to generate histograms and dot plots.
All flow cytometers are able to interrogate cells and generate data, but only cell sorters can sort cells in a second stage where electrostatic cell sorting takes place.
Once a cell type (or more than one cell type) has been identified, and after the machine is set with the sort criteria, the cell sorter will use electrostatic charge to separate the cells from the sample.
This electrostatic charge is applied to the stream when the particle matching criteria set on the machine reaches the 'break off point' (i.e. where the stream begins to form individual droplets that encapsulate single cells). So that the droplets do not break off at random distances from the nozzle the break off point is controlled as the nozzle through which it passes is vibrated at a high frequency.
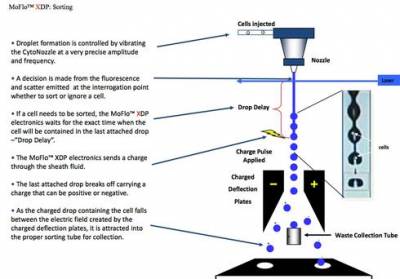
Image: courtesy of Beckman Coulter Ltd
Once the charge is applied the droplet containing the cell of interest breaks away from the stream and is deflected left or right depending on the charge applied and can then be collected at the base for further study.
The ability of flow cytometers to analyse cells at high flow rate (up to 100,000 events per second) and to detect low signals make it possible to count cells and simultaneously analyse several cell physical and chemical properties with high sensitivity and in a very short period of time. Flow cytometry is also the technology of choice when it comes to purification of cells and separation of complex mixtures of cell populations.
- Selecting Fluorochromes for FCM
The most powerful aspect of flow cytometry is the fast and simultaneous multiparametric analysis of proprieties of single cells. Sophisticated flow cytometers capable of analysing signals of up to 18 fluorochromes at the same time are available today. It is becoming routine to do 5 to 7 colour experiments without major difficulties. While it's becoming easy to choose the right combination of fluorochromes that fit into the available instrument, it can be quite challenging to find in the market the right fluorochrome conjugated to the antibody of interest.
There are few basic rules that one should consider when choosing a fluorochrome or a combination of fluorochromes.
- Check with us what fluorochromes we can excite and detect. There are fluorochromes that can be used on a microscope but cannot be excited in a given flow cytometer. The UCL ICH Flow Cytometry Facility has hardware that can cover almost all flow cytometry applications.
- Choose the brightest fluorochrome for the less-well-expressed antigen and the dimmest fluorochrome for the most-well-expressed antigen. The following is an example of classification of commonly used fluorochromes, starting from the brightest and ending with the dimmest:
PE > AlexaFluor647 > APC > PECy7 > PECy5 > PerCPCy5.5 > PEAlexaFluor610 > AlexaFluor488 > FITC > PerCP > APCCy7 > AlexFluor700 > Pacific Blue > AmCyan - Chose fluorochromes to minimise spectral overlap. It is important to know that every fluorochrome has a wide fluorescence emission spectrum that extends beyond the narrow window of light allowed by an optical filter for a specific fluorochrome. Depending on the level of spectral overlap, signals can or cannot be corrected (compensated). There are spectra viewers (BD, Biolegend, ThermoFisher) on the web that can help you check if two or more fluorochromes can be combined together. However, the spectra viewer should be used with the optical filters installed on the flow cytometer available and cannot replace a test experiment.
- Check the availability of your antibodies conjugated to the fluorochromes of your choice. As there are methods for direct conjugation of antibodies to specific fluorochromes, you may want to consider making your own fluorochrome conjugated antibodies if they are not available in the market.
- When using tandem dyes, follow the manufacturer's storage and manipulation guidelines to avoid their rapid degradation
- Books on Flow Cytometry
For users who want to extend their knowledge in this fast evolving technology, there are a few published books on flow cytometry; some of them are available for free on the web:
- Macey MG (2007) Flow Cytometry: Principles and Applications. London, Humana Press.
- Haugland RP (2005) The Handbook - A Guide to Fluorescent Probes and Labeling Technologies, 10th Edition. Eugene, Invitrogen - Molecular Probes.
- Watson JV (2004) Introduction to Flow Cytometry. Cambridge, Cambridge University Press.
- Howard M Shapiro (2003) Practical Flow Cytometry. 4th Edition. Wiley-Liss.
- McCarthy DA, Macey MG (2001) Cytometric analysis of cell phenotype and function. Cambridge, Cambridge University Press.
- Ormerod MG (1994) Flow Cytometry: A Practical Approach. Oxford, IRL Press.
- Robinson JP (1993) Handbook of Flow Cytometry Methods. New York, Wiley-Liss.
- Givan AL (1992) Flow Cytometry. First Principles. New York, Wiley-Liss.
- Quick Flow Cytometry Tutorials
Cell sorting applications
- Cell Sorting
All flow cytometers are able to interrogate cells and generate data, but only cell sorters can sort cells in a second stage where electrostatic cell sorting takes place.
Once a cell type (or more than one cell type) has been identified, and after the machine is set with the sort criteria, the cell sorter will use electrostatic deflection of charged droplets of sheath fluid to separate the cells from the sample.
An electrostatic charge is applied to the stream when the particle matching criteria set on the machine reaches the 'break off point' (i.e. where the stream begins to form individual droplets that encapsulate single cells). So that the droplets do not break off at random distances from the nozzle the break off point is controlled as the nozzle through which it passes is vibrated at a high frequency.
Once the charge is applied the droplet containing the cell of interest breaks away from the stream and is deflected left or right depending on the charge applied and can then be collected at the base for further study.
Cells can be collected in several devices or in standard plates. Single cells can also be sorted into 96-well plate for cloning purposes.
We can sort:
- Any identifiable cell population of interest (see phenotyping below) defined by up to 17 fluorescence parameters
- Up to 4 cell populations can be sorted at the same time
- Cloning: single cell sorting and cloning into 96-well plates. Cells can be selected from scatter (no staining is necessary) or from any identifiable cell population.
- Cell cycle phases (in live or fixed cells)
- Most of fluorescent proteins: BFP, CFP, GFP, YFP, Venus, mOrange, mRFP, mCherry. dTomato, mKate, etc...
- GFP/YFP separation and sorting
- Stem and rare cells
- Hoechst Side Population (see below)
- G0 and G1 in Hoechst and Pyronin Y stained live cells
- Hoechst Side Population
Hoechst side population analysis is a valuable flow cytometry technique for the identification, enrichment, and purification of stem cells and early progenitors in a variety of human and non-human tissues. Although the technique was initially optimised on hematopoietic cells, it has since been used on different cell lines and tissues.
This method is based on the passive uptake of Hoechst 33342 DNA dye by live cells of interest. Stem cells and early progenitors are able to pump out Hoechst via the ATP-Binding Cassette (ABC) transporters allowing the observation of a cell population that has a Hoechst low fluorescence in both blue and red region of the spectrum. Propidium Iodide (PI) is added to exclude dead cells and its bright red fluorescence is collected with the same detector as Hoechst red fluorescence. ABC pumps can be specifically inhibited by drugs such as verapamil (100 µM final concentration) or reserpine (5 µM final concentration) and samples treated with one of these drugs 15 min before Hoechst incubation should show loss of SP phenotype and can be used as control to confirm SP identification. SP phenotype depends on Hoechst concentration, incubation time, and temperature stability. These conditions can dramatically vary with cell type. A preliminary kinetic experiment to optimise these conditions is critical for the success of this technique.
Our facility is suitable for Hoechst SP analysis and sorting. We have flow cytometers equipped with true UV lasers that can efficiently excite Hoechst dye and generate a very good Hoechst cell cycle profile.
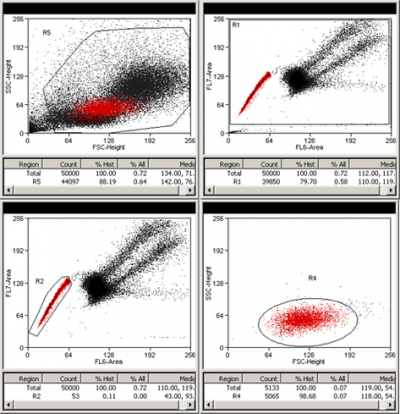
Above is an example of Hoechst SP profile. Murine bone marrow cells were stained according to Goodell's protocol. Briefly, cells were incubated in 5 µg/ml Hoechst 33342 solution at stable 37 °C temperature for 90 min. Cells were then washed with and resuspended in cold medium and kept on ice till they were sorted. Hoechst signal was collected on the MoFlo XDP cell sorter as follows: Hoechst blue fluorescence was collected using 450/65 filter (FL7-Area) and PI and Hoechst red fluorescence was collected with the 620LP filter (FL6-Area). R1 gate excludes dead cells, which are PI bright and out of scale. 440LP dichroic mirror was used to split Hoechst signal into blue and red fluorescence.- Phenotyping
MoFlo: PBMCs CD3 CD4 Sort
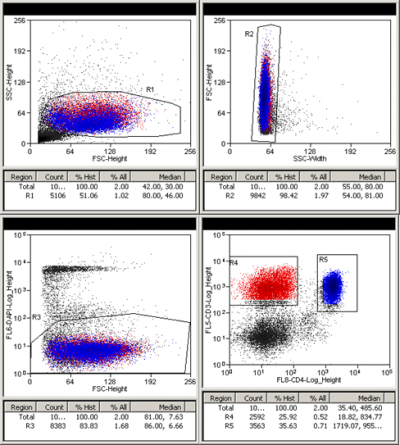
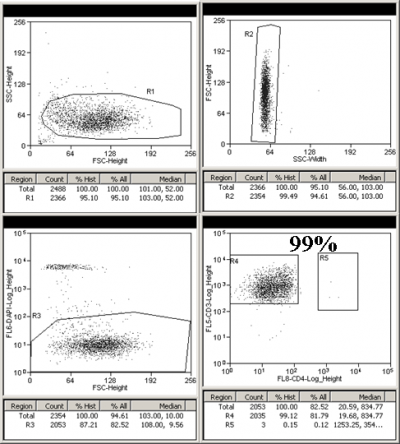
Frozen PBMCs from a healthy person were depleted of CD14+ monocytes using STEMCELL Technologies EasySep magnetic bead separation. The CD14 negative fraction was spun down and stained with CD3 PECy7 (FL5: 780/40) and CD4 APC (FL8: 670/20) antibodies in Sort Buffer (PBS + 2% FBS + 2-4mM EDTA) for 30 min at 4C. The cells were washed, re-suspended in Sort buffer, and strained through a 70 micrometer filter. DAPI (FL6: 450/65) was added just before the sort and single live lymphocytes were sorted for CD3+/CD4+ and CD3+/CD4-. A 10 micro liter aliquot of each sorted cell population was added to 190 microliter PBS and was rerun to check sort purity.
Presort:
CD4 negative purity check
Frozen PBMCs from a healthy person were depleted of CD14+ monocytes using STEMCELL Technologies EasySep magnetic bead separation. The CD14 negative fraction was spun down and stained with CD3 PECy7 (FL5: 780/40) and CD4 APC (FL8: 670/20) antibodies in Sort Buffer (PBS + 2% FBS + 2-4mM EDTA) for 30 min at 4C. The cells were washed, re-suspended in Sort buffer, and strained through a 70 micrometer filter. DAPI (FL6: 450/65) was added just before the sort and single live lymphocytes were sorted for CD3+/CD4+ and CD3+/CD4-. A 10 micro liter aliquot of each sorted cell population was added to 190 microliter PBS and was rerun to check sort purity.
CD3+CD4- purity check
CD4 positive purity check
Frozen PBMCs from a healthy person were depleted of CD14+ monocytes using STEMCELL Technologies EasySep magnetic bead separation. The CD14 negative fraction was spun down and stained with CD3 PECy7 (FL5: 780/40) and CD4 APC (FL8: 670/20) antibodies in Sort Buffer (PBS + 2% FBS + 2-4mM EDTA) for 30 min at 4C. The cells were washed, re-suspended in Sort buffer, and strained through a 70 micrometer filter. DAPI (FL6: 450/65) was added just before the sort and single live lymphocytes were sorted for CD3+/CD4+ and CD3+/CD4-. A 10 micro liter aliquot of each sorted cell population was added to 190 microliter PBS and was rerun to check sort purity.
CD3+CD4+ purity check:
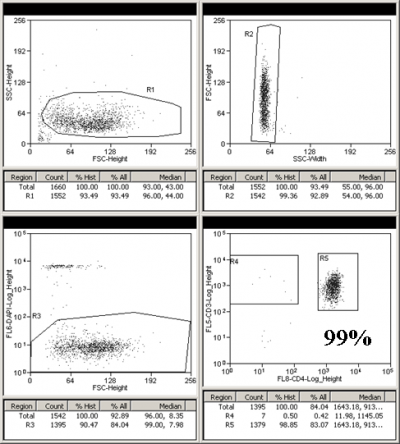
FACSAriaIII: PBMCs Tcells, B cells, NK cells, and Monocytes.
Cell analysis applications
- FRET: Fluorescence resonance energy transfer
Fluorescence resonance energy transfer, or FRET, is a very useful technique that permits the measurement of proteins interactions. Combined with multiparametric flow cytometry, FRET offers an attractive tool to study protein interactions in real-time in a large number of individual cells and in a short period of time. Flow cytometric FRET also offers cell sorting of single cell or population of live cells that show FRET for further study. Flow cytometric FRET uses fluorescently taged proteins to measure energy transfer from an excited fluorophore (donor) to a neighboring fluorophore (acceptor) through dipole-dipole interactions. FRET only happens if:
- the donor and acceptor fluorophores are brought within close proximity
- the fluorescence emission of the donor overlaps with the excitation spectrum of the acceptor
- the donor and acceptor are properly oriented
When FRET is successful, the fluorescence intensity of the donor decreases and the fluorescence of the acceptor is detected in a new channel linked to the donor's excitation source.
These are some common pairs of FRET used in flow cytometry:
- CFP and YFP
- GFP and RFP
- AF488 and Cy2
- AF546 and AF555
Cyan fluorescent protein (CFP) and yellow fluorescent proetien (YFP) can be fused to cellular proteins without affecting their localisation or their function. Consequently CFP/YFP FRET allows in vivo analysis of active protein interactions at their native localisation.
CFP is excited by the 405nm violet laser ; YFP is excited by the 488nm blue laser and is not directly excited by the 405nm violet laser. In samples where cells are expressing both fluorescent protiens, CFP and YFP, when CFP and YFP are not interacting, CFP fluoerscence in collected in the 450/50 channel from the violet laser excitation and YFP fluoerscence is only detectable in 530/30 channel from the blue laser excitation.
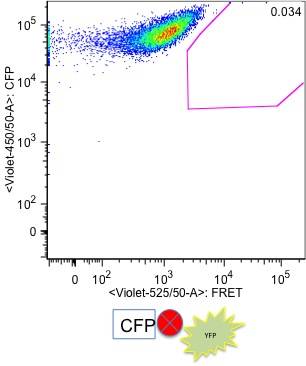
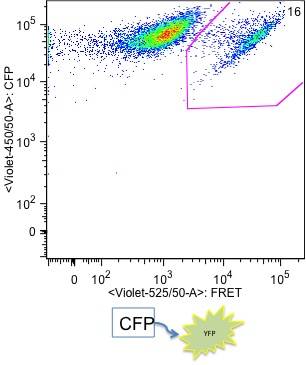
In cells where CFP and YFP are close (10 nm) to each other, YFP is excited by fluorescence emitted by CFP. This YFP fluorescence, which is generated by FRET via CFP fluorescence, is detected in 525/50 channel (FRET channel) from the violet laser. Because only a small number of CFP and YFP molecules are FRETing on each cell, the cells that show FRET still have high CFP fluorescence intensity. However, only cells that show FRET have YFP emitting fluorescence in FRET channel (525/50 on the violet laser line).
- DNA Content Analysis
The measurement of DNA content of cells is one of the earliest and major application in flow cytometry and still is one that is extensively used today. DNA content analysis by flow cytometry can provide valuable information about the cell cycle status of individual cells
DNA content measurement demands high precision because small variations in DNA content can have considerable biological significance.
Precise measurement of DNA content becomes possible thanks to the availability of nucleic acid specific fluorescent dyes and the availability of powerful flow cytometers capable of measuring with great precision fluorescence coming from inside cell nucleus.
DNA analysis combined with immunofluorescence and multi parametric flow cytometry provide a powerful tool for diverse biology research fields such as immunology, cell biology, cancer and stem cell research, etc... Hence, it's used to study cell cycle, monitor cell growth and detect perturbations of cellular proliferation due to physical, chemical or biological assaults. It also has clinical applications such as tumours diagnosis and chemotherapy monitoring.
Most of fluorescent dyes can stain nucleic acid (DNA and RNA) but only few of them can specifically bind DNA. A large number of the latter are sensitive to base composition of DNA.
Some nucleic acid dyes: Propidium Iodide, 7-amino-actinomycin-D, DAPI, Hoechst dyes, Sytox dyes, DraQ5, DraQ7, Vybrant DyeCycle, Acridine Orange, Pyronin Y, Cyanine dyes (Topro3).
Live cells exclude most of these dyes, so fixation and permeabilisation are a necessary procedure for staining. Some DNA dyes such as Hoechst, DraQ5, and Vybrand Cycle dyes can readily stain live cells and can be used to directly measure DNA content and determine cell cycle phases in non-fixed non-permeabilised live cells.
DNA dyes can bind DNA in a stochiometric way allowing quantification of the amount of DNA in every cell by flow cytometry. When using Propidium Iodide (PI) or any other nuclei acid dyes, cells can be treated with RNAse A to eliminate RNA beforehand to specifically stain for DNA.
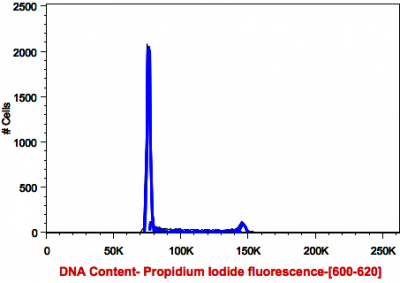
Cells stained for DNA content (see above) show three distinct cycles: G0/G1, S, and G2/m. when cells are fixed with 70% Ethanol and stained with Propidium Iodide. Single cells (nuclei) (see below) can be targeted by plotting area vs height of signal peak. subG1 region of the cell cycle can be used to quantitate apoptotic cells, which have lost a certain amount of their DNA.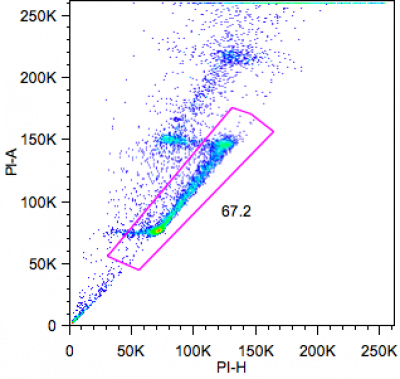
Cell cycle can be combined with proliferation assays in live or fixed cells. BrdU staining using acid/DNAse treatment or Click-iT Edu (see below) staining from Invitrogen based on click chemistry gives the amount of cells in S phase and can be used to study cell cycle kinetics.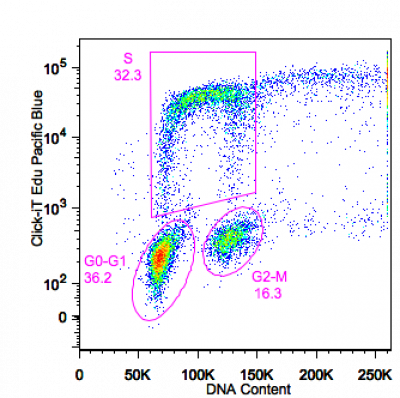
- Cell Viability analysis
Cell viability can be measured to either exclude dead cells from analysis or to study the physiological state of cells. In both cases, fluorescent or non fluorescent dyes are available to distinguish dead and live cells.
Dead cells tend to non specifically bind many reagents. When immunophenotyping a cell population it is always useful to remove dead cells from acquired data to avoid false positive result.
Live or viable cells can exclude most of viability dyes but can also take up and retain some other fluorescent dyes, which can be used to label intact cells.
Dead or nonviable cells loose integrity of their cell membrane and become permeable to many dyes. They also let fluorescent dyes leak out of their cytoplasm.
Cell viability can be measured by changes in morphology or by changes in membrane permeability. Changes in morphology can be detected by forward and side scattered characteristics but this can be a crude measurement of viability. But, a more accurate way of measuring cell viability is by making use of cell exclusion of certain dyes or cell uptake and retention of others.
Assessment of cell viability by non fixable viability dyes
Most DNA-binding dyes (few exception: Hoechst33342, Draq5, and Vybrant® DyeCycle) are excluded by viable cells and can be used as viability dyes. They passively and rapidly enter nonviable cells with compromised membrane and stain their nuclei.They can be added to non fixed (intact) samples just before acquiring data. These dyes cannot be used with fixed cells because they leak out of dead cells after fixation and stain cells that were live before fixation. The table below shows most commonly used viability dyes in flow cytometry for non fixed cells.
Viability dye Excitation Max (nm) Emission Max (nm) Propidium Iodide 350/488/535 617 DAPI 345 455 7AAD 488/548 660 TO-PRO-3 642 660 Assessment of cell viability by fixable viability dyes
When fixation of sample is required, amine reactive dyes from Invitrogen or Fixable Viability Dyes from eBioscience or Violet fixable dye from BD, can be added to samples to discriminate live and dead cells prior to fixation. This distinction is preserved after fixation. The table below shows a list of fixable viability dyes used in flow cytometry.
Excitation (nm) Emission Max (nm) Manufacturer Live/Dead Fixable Dead Cell Stain Blue 350 450 Invitrogen Violet 405 451 Invitrogen Aqua 405 526 Invitrogen Green 488 520 Invitrogen Yellow 405 575 Invitrogen Red 488 615 Invitrogen Far Red 633 655 Invitrogen Near Infra Red 633 750 Invitrogen Fixable Viability Dye eFluor450 405 450 eBioscience eFluor660 633 660 eBioscience eFluor780 633 780 eBioscience BD Horizon VD450 405 450 BD Assessment of cell viability by cell functionality
Cell viability determined by dye exclusion can give false information about real health status of cells, especially when cells can exclude viability dyes but cannot proliferate or grow. To make sure cells are viable and can proliferate, a functionality assay is necessary.
Dyes requiring Esterase activity
Cell health can be measured by dyes that requires a specific cell function, like esterase activity in addition to an intact cell membrane. These dyes are usually nonfluorescent and are designed to easily enter healthy cells. Once inside cells, they are cleaved by esterases to generate a fluorescent product, which is retained in live cells with intact cell membrane and leaks out from cells with compromised cell membrane. In this case viable cells remain fluorescent and nonviable cells become non fluorescent.Dye Excitation (nm) Emission Max (nm) Manufacturer Calcein AM 488 517 eBioscience/Invitrogen Calcein Violet AM 405 450 eBioscience Calcein Blue AM 350 450 eBioscience/Invitrogen Calcein red-Orange 577 595 Invitrogen 5-CFDA AM 488 510 Invitrogen CMFDA 488 510 Invitrogen Oregon Green 488 488 524 Invitrogen Dyes accumulating in mitochondria
Another cell function that can be used to check cell health is the status of mitochondria. Mitochondria function depends on active mitochondria membrane potential. Live cells have functional mitochondria with active membrane potential that can retain some dyes compared to non functional mitochondria. Mitochondria membrane potential can be used to measure cell health and viability.Dye Excitation (nm) Emission Max (nm) Fixation JC-1 488 530/595 No Rhodamine 123 488 530 No TMRM-TMRE 488 574 No MitoTrackers 488/561/633 530/590/670 Yes - Cell Proliferation Analysis
- Multicolour Analysis
- Apoptosis Analysis
Tunel Assay
Mitochondrial membrane potential: TMRE, MitoTrackers Red CMXRos, DIOC6, etc...
Reactive Oxygen Species (ROS) detection
Cytochrome C release (by antibody staining in fixed cells, or by Nonyl Acridine Orange in live cells)
Hoechst red shift
Caspases activation detection (by antibody in fixed cells or FLICA and Phiphilux in live cells)
- Calcium Flux
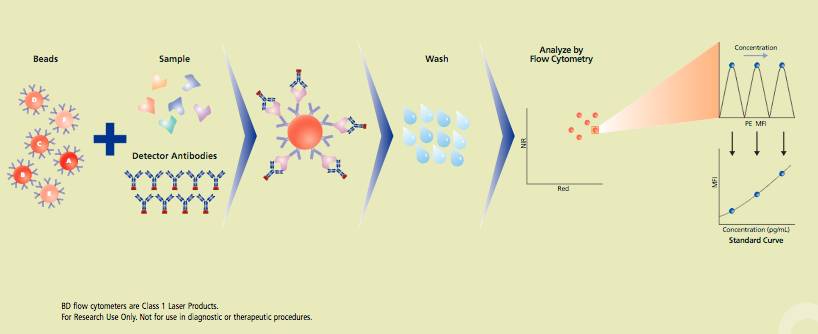
- Analytes (Cytokines, chemokines, etc ) detection
BD CBA:
- GFP/YFP Separation
- Red fluorescent proteins detection (mRFP, mCherry, etc)
- CompBeads for compensation
- Absolute count using counting beads
 Close
Close


