The changing verb phrase in present-day British English
Findings
Verb phrase density across spoken text categories
Research questions
- Does VP density (the frequency of verb phrases per million words) vary in DCPSE over time, across the different spoken text categories (e.g. informal conversations, broadcast discussions, prepared speech)?
- Does tensed VP density vary over time across spoken text categories?
- What are the implications of these findings for the study of current change in the verb phrase?
Summary of main findings
- When all text categories are considered together, VP density does not vary significantly over time in DCPSE (from the 1960s-1970s subcorpus, LLC, to the 1990s one, ICE-GB). The same is true for tensed VP density.
- However, there is significant variation in VP density over time in particular text categories. The same is true for tensed VP density.
- These findings show the importance of choosing a suitable baseline for measuring frequency of grammatical items occurring within the verb phrase, particularly when different text categories are compared. For example, modal auxiliaries can occur only in tensed VPs. If we choose tensed VPs as the baseline for measuring their frequency (i.e. if we calculate the rate of modals per tensed VP), we can focus on the grammatical contexts where speakers have the choice of using a modal, and factor out the variation in tensed VP density. (See findings on Core modals.)
Data for tensed VP density

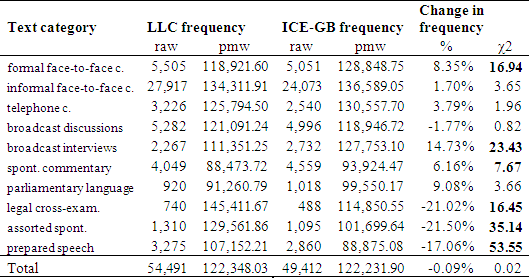
Table 1. Tensed VPs per million words, by text category, compared
across the two subcorpora of DCPSE. Chi-square values in bold are
significant at p<0.05. Abbreviations: c. = conversations; spont.
= spontaneous; cross-exam. = cross-examination.
Tensed VPs were identified in the corpus by searching for any auxiliary or main verb bearing the tense feature 'present' or 'past' (as each VP can include at most only one tensed auxiliary or main verb). Table 1 shows the frequencies of tensed VPs per million words in the two subcorpora of DCPSE, LLC (1960s-1970s) and ICE-GB (1990s), broken down by text category. It also shows the percentage changes in frequency and the results of chi-square tests for statistical significance of these changes. The results are visually displayed in the two figures below.

Figure 1. Tensed VPs per million words, by text category, compared
across the two subcorpora of DCPSE.
Figure 1 shows tensed VP density in the two subcorpora of DCPSE, by text category. It can be seen that there is considerable variation in tensed VP density among text categories. For example, spontaneous commentary and parliamentary language have a relatively low density of tensed VPs in both LLC and ICE-GB.

Figure 2. Percentage change in per million word frequencies of tensed
VPs, by text category, across the two subcorpora of DCPSE. The error
bars represent 95% confidence intervals.
Figure 2 shows the percentage changes in tensed VP density over time. Where the error bars do not cross the zero axis, the results are significant. It can be seen that tensed VP density increases significantly in three categories (formal face-to-face conversation, broadcast interviews, and spontaneous commentary), and decreases significantly in three categories: legal cross-examination, assorted spontaneous, and prepared speech. Overall (with all text categories taken together), there is no significant change over time.
This page last modified 14 May, 2020 by Survey Web Administrator.