The Rock & Ice Physics Laboratory at UCL is a major research facility. We have over 15 members and 11 laboratories, housing over £4M of research equipment. RIPL has excellent experimental and sample preparation facilities as well as excellent technical and engineering support, giving us a unique breadth of experience and ability to design and build our own experimental apparatus.
Triaxial Deformation & Tomography Cell
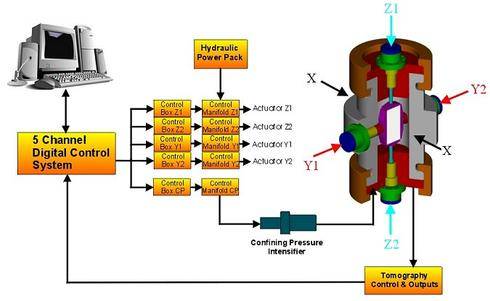
- Pressure Vessel Design
The pressure vessel itself is manufactured from a super duplex stainless steel alloy. The main vessel body measures 360 mm OD x 200 mm ID x 700 mm long, weighing approximately 500 kg. The vessel has a closure plug at each end. The bottom closure has numerous electrical leadthroughs for the tomography system as well as a high pressure connection for the confining pressure inlet. The closures are retained in place by a set of quick release clamps which are simply slid in and out of position and located by dowels. This facilitates a fast and efficient method for loading and unloading the vessel, eliminating the need for a more complex breech nut and retaining screw arrangement. Load is applied by 4 hydraulic actuators, two on the cross bores and one each in the the top and bottom closures.

Loading Actuators
The cell consists of four servo controlled hydraulic actuators Y1, Y2, Z1 and Z2, each capable of exerting a force of up to 6 tonnes on the ice sample under test. Each actuator consists of a low and high pressure piston. The high pressure piston is pressure balanced by bleeding the confining pressure from inside the vessel to the annulus at A, whilst keeping the annulus at B at atmospheric pressure. This effectively balances the internal pressure acting on the piston. The major advantage of this balanced piston design is that the actuator only has to supply the differential load and this differential load can be measured more accurately.
- Control System
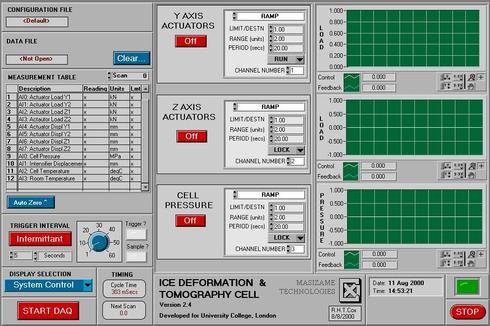
The control system for this apparatus needs a high level of adaptability to enable a large of range physical parameters to be measured. Cross coupling between the loading axis requires several measurement compensations to be carried out in real time to ensure total experiment control. The above diagram shows a detailed schematic of the control system.
Up to two RT Mother boards with 16bit acquisition daughter boards, each having 16 single ended analogue inputs and two analogue outputs, are used to provide the heart of a multi-axis digital servo hydraulic controller. A specially developed application utilising Labview RT development software provides the ‘error amplifier’ and ‘valve drive’ voltage via the analogue outputs to drive a precision hydraulic servo valve attached to each of the 60kN double acting hydraulic actuators.
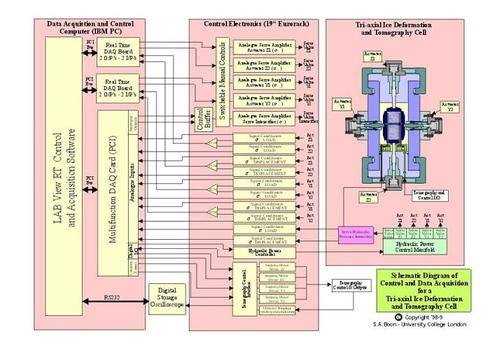
The Labview RT application uses a series of layered windows to provide viewing and setting up of: -
- Load or displacement increments, ramp rate and tomography transducer selection
- Overall test progress of tomography with load and displacement monitoring
- Control loop function (PID and other outer loop controls for changes in ice sample stiffness)
- Mode of control (Load or displacement) for individual or paired actuators
- Graphs for stress and strain for each axis
- Ultrasonic transducer pulsing levels and digital oscilloscope controls
- Transducer calibration Test data capture and replay
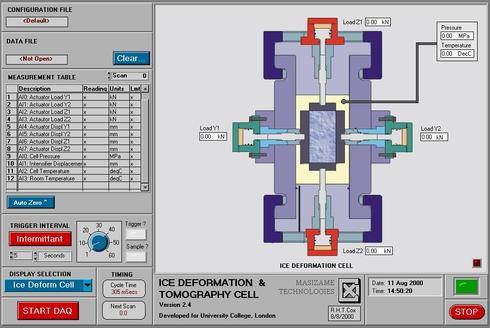
The Bi-axial Deformation Control application ‘downloads’ the RT board control programme to the RT boards after the test parameters are entered then awaits the commands from the PC based main application. Regular ‘handshake’ commands between the main control programme and the RT board ensures a safe shut down in cases of main PC hardware or software problems.
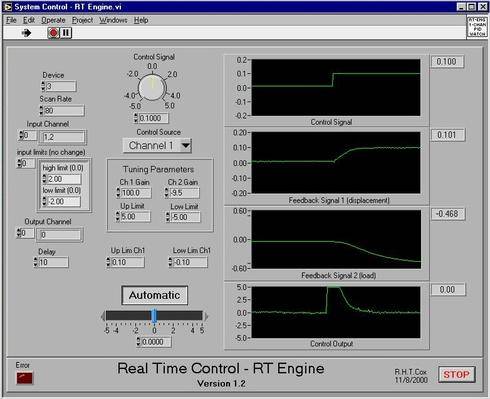
The RT board control programme effectively closes the control loop by taking data from the test set-up provided by the main programme to modify the valve drive voltage to the actuator systems provided by the analogue output channels. Feedback is provided directly to the RT boards by the conditioned transducer signals that are connected to the board’s analogue input channels. The transducer signals are modified by the use of calibration polynomials for each transducer and the system stiffness/compliance calculated from the axis load to provide true real time representation of the command input.
The command input will be modified from rate information in a lookup table generated when the control programme is loaded. The ‘handshake’ system will stop and start the ramping of actuator pairs between each tomography cycle.
The main control programme will control the acquisition of data for: -
- X axis Actuator load and displacement transducers
- Y axis Actuator load and displacement transducers
- Confining pressure
- Cell temperature
Tomography control and data capture
A 12 bit PCI Data Acquisition board will perform the data capture. This board will also provide the stepping motor control and timing for the ultrasonic transducer tomography system by: -
Setting the pulse generator trigger rate Providing the external trigger for the DSO Pulsing and direction control of the drive amplifiers for the Y axis Ultrasonic transducer positioning stepping motors Pulsing and direction control of the drive amplifiers for the Z axis Ultrasonic transducer positioning stepping motors Ultrasonic transducer clamping/unclamping Ultrasonic transducer selection
The ultrasonic transducers are specially designed ‘pressure wave’ and ‘shear wave’ devices mounted in the loading anvils and on the tomography carriages. The control application will allow the switching of ultrasonic transducer transmitters and receivers to ensure the required pattern of data is achieved to ensure the physical parameter changes in the ice specimen can be measured when each loading increment is achieved by the servo controller.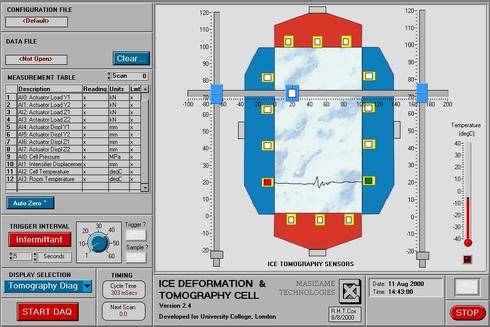
The received waveforms from the transducers are amplified and measured using a Gould DSO which is controlled by the Bi-axial control application via a IEEE interface. The programme enables capture of Ultrasonic 'P' and 'S' wave velocities and has the ability to capture complete waveforms for further analysis. 'P' wave information will be analysed within the application and displayed on the in 3D format using embedded National Instrument Hi-Q software.
Future developments
We propose to use a fast DSP based data acquisition card to provide the function performed by the DSO which should reduce the waveform capture time and reduce the total time to perform an experiment.
Acknowledgements
A major contribution to the development of the Bi-axial Control Application is being carried out by Rory Cox of :
Riordan Cox and Associates Pty Ltd,
2 Forest Park Road,
Upwey,
Melbourne,
Victoria,
AUSTRALIA,
3158.
E-mail: rorycox@ozemail.com.au
Website: http://riordancox.com- Tomography System
- The diagram to the right shows a schematic representation of the mechanism for moving and clamping the ultrasonic transducers within the pressure vessel.
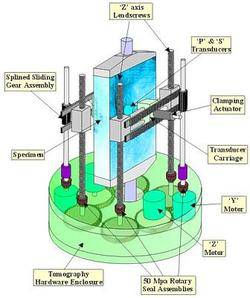
With this arrangement, the specimen can be mapped using 'P' and 'S' wave transducers during prolonged creep tests or incrementally during strength tests. Stepper motors and leadscrews will allow each transducer to be independently positioned for the next measurement.
Clamping of the transducer to the specimen for shear wave measurements will be provided by a minature hydraulic actuator.
Please note:- This diagram shows loading platens in one axis only, for clarity.
- Sample Assembly
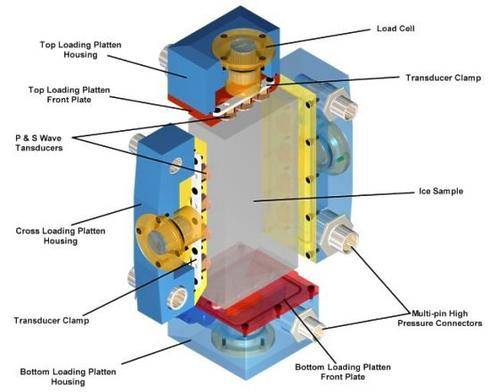
The above diagram shows the arrangement of the sample assembly. This 3D View generated from the Autocad design drawings show 'Y' and 'Z' axis loading anvils with wave velocity transducers for tomography in these directions. Each anvil incorporates an independent loadcell with full bridge strain gauges for closed loop control feedback and monitoring.
Special multi-pin connectors that can accept the low temperatures and high pressures are incorporated into the design to isolate the transducer from the confining pressure.
This arrangement shows 4 pairs of transducers in the 'Y' axis (P & S wave) and 3 pairs in the 'Z' axis. The conditioning electronics is designed to accept up to 16 pairs of transducers including 'X' axis transducers shown below.
The loading plates are counterbored to accept the 'P' and 'S' wave crystals.
The signals from the 'P' wave transducers can be independently conditioned for monitoring acoustic emissions.
 Close
Close

