 Close
Close

Creating the UK's largest data display for the London Transport Museum
In 2010, at the Techonomy Conference in the USA, Google CEO Eric Schmidt said, 'Every two days now we create as much information as we did from the dawn of civilisation up until 2003.'
1 August 2016
Today, it's reckoned that 90% of the data in the world was created in the last two years
All those texts, tweets, internet searches, social media posts, game plays and store and card transactions we're making have led to what we know as 'Big Data.' These data sets are so large or complex that our traditional methodologies can't process them. So how do we capture, clean, store, analyse, access and action all that information to make it genuinely useful and beneficial?
This was the problem London Transport Museum (LTM) gave to Dr Ed Manley of The Bartlett Centre for Advanced Spatial Analysis (CASA), University College London (UCL).
Helping LTM's Transported by Design exhibition make all the right connections
Ed and his team were given the task of substantially redeveloping the museum's existing Connections wall display, utilising visualisation to enable visitors to better understand the enormous amount of data available from Transport for London's large and complex technology infrastructure.
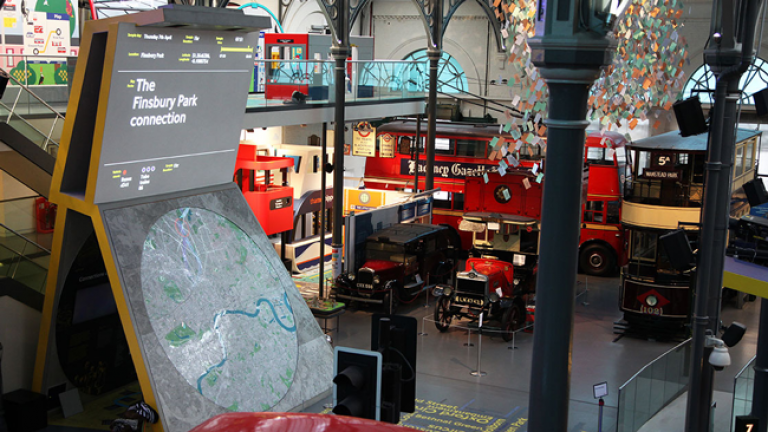
This updated version of Connections is at the heart of a new exhibition called 'Transported by Design.' It is the UK's largest data display, combining striking 3D design, 55,000 model buildings, projection and transport information.
Covering the 16 kilometres of London from Kensington to Greenwich Peninsular, Connections enables visitors to walk behind the relief model to see the sheer scale of the Capital's transport system. It shows the geographic relationship and travel interrelationships of the Underground to the road network above. Plus it all works in real-time.
Ed comments, 'The project for us meant two key tasks. Firstly, we created the Application Programme Interfaces (APIs) to capture, clean and sort the data from myriad sources around the Capital's transport network. These ranged from under and overground trains, buses, riverboats and bicycles to bus stops, tracks, signals, platforms and stations. We then propagated the visualisation part of the museum's Connections display with all that information - all in real time. Secondly, we developed a narrative that describes compelling transportation phenomena in London, in line with the Transported by Design concepts, via a series of 12 multi-modal case studies.'
The CASA team worked with a London-based research and design studio - Kin - on the creation and development of the visualisation. As a result, anyone visiting the Connections display - which opened in November 2015 - can see and experience in three dimensions what a complex, living and breathing organisation the transport infrastructure is for a dynamic city like London.
Dashboards - moving data driven organisations forward
He added, 'As part of the project we developed a set of city 'dashboards' for the museum and a number of users. These range from Transport for London (TfL) and the Mayor of London's office to the Greater London Authority (GLA) and other interested businesses.'
Dashboards are so named because of the way they resemble a dashboard in a vehicle. They are intelligent data visualisation tools that can consolidate, organise and display the current status of a multitude of information sources in real-time and on one, easy to use, read and understand screen.
Visualisation blends art and science
Ed concludes, 'Users of the dashboards that visualisation helps to create can have their key metrics and performance indicators presented in an up-to-the-moment way. One that's clear, fast and easy to understand. As a result, they can monitor, analyse and act upon this information. At TfL, for example, that means on everything from train delays and passenger movements to bottlenecks at key transport hubs. Visualisation and dashboards make big data make sense, as our work for LTM demonstrates for visitors to the Connections display. These technologies are helping many sectors, from advertising to healthcare and utilities to transport. Users can better understand complex concepts, identify trends, spot and rectify problem areas of their operations and improve customer service.'
UCL Consultants
UCL Consultants (UCLC) is the wholly owned consultancy company of UCL. We support the mission of UCL Innovation & Enterprise to transform knowledge and ideas into action.