 Close
Close

Personalised Solutions For Better Navigation Services
24 January 2019
Dr Ana Basiri, Lecturer in Spatial Data Science and Visualisation writes for Navigation News on the highlights of her presentation at the CogNav Symposium at INC2018.

Note: Examples from the 2D and 3D maps used for the navigation experiment are the work of Meenu Mohan, a postgraduate student at CASA.
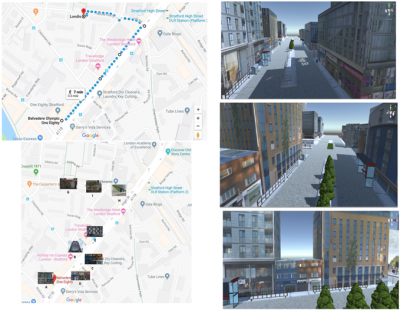
Stereotypically men are thought to be better than women at navigation and reading maps. But could this be because maps and navigation apps are being designed and developed by men and so are serving men’s needs and preferences better? Studies show that people in wealthier countries, countries with longer coastal lines, and those with higher equality measures are generally better navigators. Even on an individual scale, you can have different levels of sense of direction at different ages, and your navigation skills can be improved by exploring new environments. So, it seems to be unlikely that one single navigation service can serve all of us equally well. This article looks at different layers of navigation services and tries to provide some solutions for better navigation services for cases where the users are not ‘young men from Scandinavia’ with some personalisation features without making navigation services too intrusive or creepy. A navigation service can have four main components; maps, path finding or routeing engine, positioning technology, and finally communication and navigational instructions. Each of these components can have some levels of adaptation and personalisation to serve the users as best as possible. Let’s start with maps; No, calm down! I am not going to ruin our lovely maps just because I can never tell where North is. But let’s face it, maps have remained almost unchanged for such a long time but they need some changes. One of our master’s students performed an experiment with 2D vs. 3D maps. She created a 3D model of Queen Elizabeth Olympic Park in London and asked people, who were not familiar with the environments, to read the 3D maps and find some destinations using it. Then she asked another group of tourists to do the same with our traditional 2D maps that we all have from Google Maps, or Bing Maps or others. It may look surprising to know that women could find their destinations faster, with fewer mistakes (getting lost or turning onto a wrong road), while remembering a greater number of landmarks and with a much higher level of details than men. So yes, men may read maps better than women but only in the 2D world!
Examples of the 2D and 3D maps used as part of the navigation experiment.
In addition to map visualisation, some studies looked at the role of gender and the map features’ representations. For example, in OpenStreetMap which is a crowdsourced and user-generated map, the absolute majority of men abandoned a suggestion regarding having more than one amenity tag describing a place that cares for children (as pre-school, childcare, child hospice, nursery, kindergarten all looked the same!) while a great deal of attention was given towards sexual entertainment facilities and detailed services/features! Also, the cartographical practices could be improved if colour-blind users had a louder voice. With all of these in mind, one potential solution is to have a personalised map that the users produce for their own purposes. It could have a user’s favourite restaurants/shops in it, and your navigation service could use those features as well.
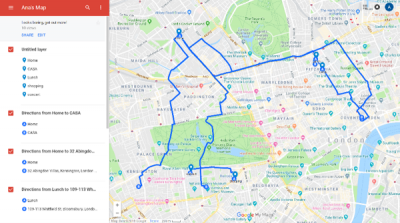
An example of a personalised map.
The second component is routing and path finding, which again was designed for a specific group of users and we all now have to use it. Routing is initially designed for drivers and so most of the path finding algorithms only work where there is a network of streets. There might be some enhance-ments regarding pedestrian-only passages but look at the figures 3 and 4 and see how routing must be different for pedestrians who can cross grasslands and parks. Current routing services project our location and find the nearest point on a network of street and then re-use ‘graph-based’ routing algorithm. We also may wish to go through a nice park (greener route) rather than taking a shortest path to get to our destination.
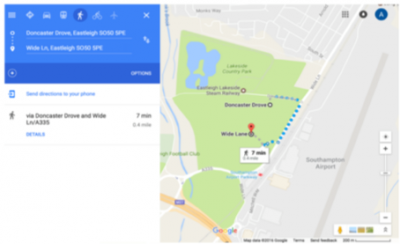
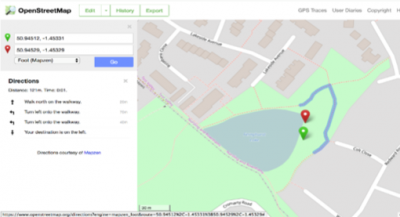
Figure 3: routing for pedestrians in Google Maps
Figure 4: Park routing for pedestrians in OpenStreetMap
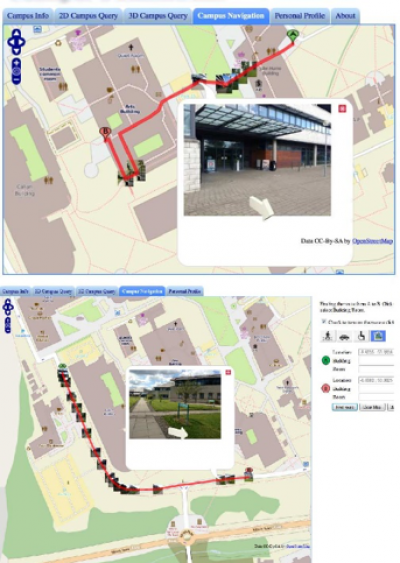
We have done a study to identify the important features for different groups of users for their pathfinding. For example, for wheelchair users the width of passage, surface condition, slop, and weather are very important features. These could help a better design of routing services. The third component is positioning and tracking. We don’t have a free-to-use, privacy-preserving, accurate, reliable, and seamless (indoor-outdoor) positioning technology yet. However, it seems the users prefer to have different levels of accuracy, privacy, and reliability according to their locations and time. We conducted a survey and discovered that location obfuscation (which is the degradation of locations in order to preserve users’ privacy) could be a good solution, however different services and different locations (e.g. closer to their home or at work) require different levels of accuracy, reliability, continuity, and even associated cost. The last component is about communication of navigational instructions. Our navigation apps can hugely improve through multi-modal communications, e.g. haptic, sounds, videos and images (of landmarks along the way). We observed a jump in our users’ satisfaction rate when we added photos of landmarks to our navigational instructions. The users feel more confident that they haven’t got lost when they see a building whose photo was provided as a part of their navigational instructions. Also, the sense of touch is one of the first senses we have and one of the last ones we lose, so it would be a good way for providing navigational instructions to whom can’t hear or see as others.
An example of multimodal communication: Adding photos of landmarks to navigation instructions resulted in a jump in user satisfaction.
Well, we started with a ‘turkeys voting for Christmas’ situation but to be fair, we should also say that navigation and personalisation are improving. If you are not a young man from Finland, then please have your say in OpenStreetMap feature design: try to create your own personalised map, and give feedback as the designers of services may not know how you see a map/app!
Read the rest of the issue (and download previous issues) of Navigation News here.