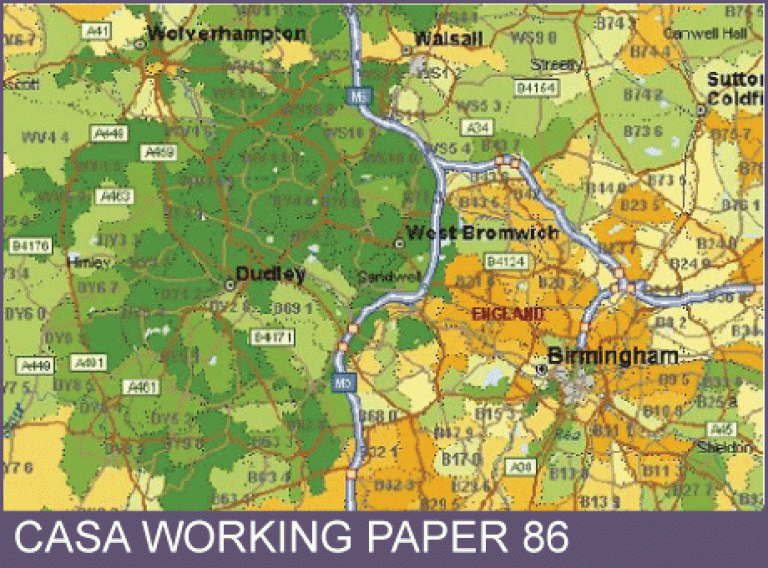
CASA Working Paper 86

1 November 2004
Demographic and Deprivation Ratios: examples of their use in understanding underlying spatial patterns in social phenomena
The intention of this paper is to explore the concept of standardized demographic or deprivation Ratios - what they are, why they might be useful, for what statistical distributions they can be built, how they can be constructed and which research activities and policy areas they might inform.
Such Ratios are designed to demonstrate the extent to which the local levels of various statistical measures are above or below the level that would be 'expected' on the basis of the demographic make up of local areas. They would answer questions such as 'Is unemployment in this town high for a place of this sort?'; 'Is the reason for the high level of vodka consumption in Scotland something to do with local history or local culture or can it be explained as a consequence of the demographics of the Scottish population?' or 'Is the level of burglary in Avon and Somerset above the level that it ought to be, bearing in mind the characteristics of its population?' The analysis of standardised Ratios is also relevant to the study of regionalization. We are used to the administrative regions in terms of which government divide the country and publish statistics.
The mapping of Standardised Ratios shows the extent to which these administrative boundaries correspond to the boundaries of 'natural' regions, these being defined as sets of adjacent areas sharing similar values on a broad range of Standardised Ratios. Relating the actual levels of social statistics to some measure of what might be expected on the basis of the population is clearly relevant to the evaluation of local performance, whether in the private or the public sector and Ratios of this sort, for example Mortality Ratios, have been used for many years by health professional to benchmark local levels of mortality against the level which might be expected on the basis of the gender and age. However the mapping of the difference between actual and expected rates can often throw interesting light on cultural differences between regions and sub regions of the country which persist despite the homogenizing tendency of central government and national or even multinational retail multiples. The paper illustrates the potential meaning and use of these Ratios by means of a set of twelve demographic and deprivation Ratios created from the 2001 census in the UK.
This working paper is available as a PDF. The file size is 1MB.
Authors: Richard Webber
Publication Date: 1/11/2004
 Close
Close

