 Close
Close

Colouring London, an open knowledge exchange platform that collates, collects, generates and visualises statistical data, aims to be the first place people go to for data on the capital's buildings.
What could you do with data on every building in London?
The principal physical component of cities is building stock. According to the International Energy Agency, buildings and the construction sector are also responsible for 36% of global energy consumption and nearly 40% of CO2 emissions – so it’s also where the greatest potential for energy reduction lies. This energy agenda has, since the 1990s, been driving a paradigm shift in the European construction industry, from a focus on new buildings to building reuse. This in turn has led to an urgent demand for granular data on older buildings and urban stocks as a whole. “It has also shown how little urban scientists currently know about these slow moving systems and their operation over time, and it has highlighted the need for investment in analysis and data in this area,” says Polly Hudson, Senior Research Fellow at The Bartlett Centre for Advanced Spatial Analysis (CASA).
Hudson’s point is that, without data on the typology of buildings that make up our cities and their size, shape, age, use and how they’re built, it’s difficult to develop effective urban strategies to maximise sustainability in cities, or to measure and monitor their long-term performance. At the same time, being able to exploit the potential, and improve accuracy, of models able to generate ‘what if?’ planning and energy scenarios relies on having access to these statistical datasets. In the UK, these are highly fragmented and, in many cases, restricted, unverified and incomplete.
“Outside the UK, comprehensive building-attribute data for cities are increasingly being released by governments as open data,” says Hudson. She cites open property tax data released in the US and The Netherlands’ Kadaster, which publishes building-attribute data including age and function, and which can be linked by any user to detailed building-geometry data to produce high-quality, colour-coded building-attribute maps for any Dutch city or town. Despite growing pressure from the open-data movement, such progress has been painfully slow in the UK. For example, though the Treasury has announced plans to open up Ordnance Survey’s OSMM footprint data, its property tax database run by the Valuation Office Agency – which forms the most comprehensive building-attribute database for the UK – remains heavily restricted. “So despite such a resource existing, academic departments continue to have to rely either on aggregated or paid-for building-attribute data at city scale,” explains Hudson.
In 2015, Hudson decided to take matters into her own hands as part of her PhD at CASA. The result, officially launched in October 2019, is Colouring London – an open, online, knowledge exchange platform designed to provide information on every building in the city. Developed over three years in partnership with Ordnance Survey, the GLA and Historic England, and in collaboration with the UCL Energy Institute (creator of the GLA London Buildings Stock Model) and the Survey of London, Hudson hopes that, by 2021, it will become the first port of call for open data on London’s building stock.
Colour-coded crowdsourcing
Colouring London is collecting over 50 types of data for each building in London. To maximise simplicity, these are grouped as 12 core categories: Location, Land Use, Type, Age, Size & Shape, Construction, Streetscape, Team, Sustainability, Community, Planning, and Like me?. Tom Russell, Technical Architect and Lead Developer on the project, says he and Polly started out with a clear vision that the project would be volunteer-led and therefore the platform would need to be intuitive and easy to engage with. “That was the core challenge from a design and build perspective: how to make something that was technically as simple as possible but provided instant feedback for the user.”
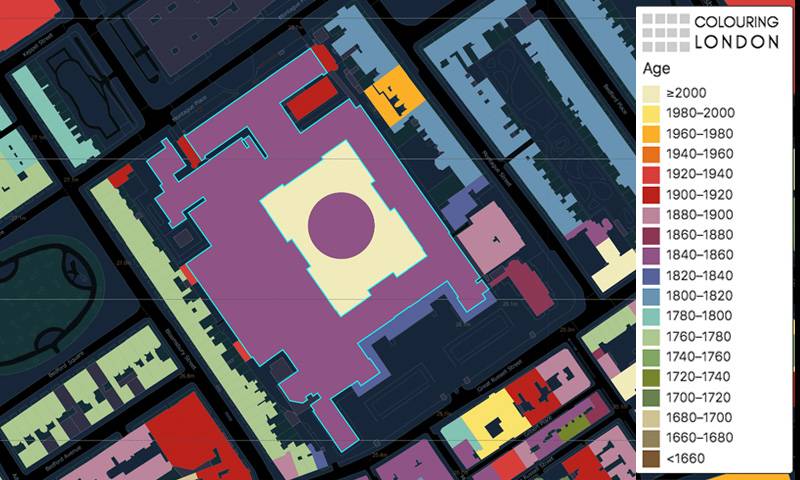
The solution was a simple gamification device: when a user edits a building and adds data, the colour of the building footprint changes according to the attribute value and the category of the data submitted (e.g. under ‘Age’, a building built between 1980–2000 will be coloured yellow; under ‘Size & Shape’, a building with 10–19 storeys turns orange). “Colour is fundamental to the project, not only in terms of the visualisation of data categories but also as a way of acknowledging each contribution,” says Hudson. “The idea is also to stimulate users’ curiosity to continue to reveal, and update changes to, the form of the city, in collaboration with other volunteers.” The use of colour-coded London maps at building and block level also continues a long tradition that includes the Booth, London County Council (Bomb damage maps), Goad and the City of London maps.
Gillian Grayson, Head of Information Analysis, Policy & Evidence at Historic England, which funded its first phase, says they “immediately identified it as potentially valuable to the challenges we and London’s local authorities face in managing change to the built environment”. As well as putting Historic England at the heart of big digital data production and visualisation, Grayson envisages practical benefits for heritage planning and energy planning. For example, she cites the use of Colouring London as a tool to support Historic England’s Heritage Action Zone initiative, which is a scheme to create economic growth and improve the quality of life in places, working with local people and partners. “The crowdsourcing element is of particular interest to us as a way of engaging the public. It is a great opportunity to raise awareness of the National Heritage List for England.”
Key to the success of the project will be the ability of CASA’s online system to drive high-quality data flows, both as uploads to the database and downloads from it for use in multiple applications. The platform not only needs to source, secure and visualise large-scale, fragmented, datasets, generate attribute using computational approaches, but also tap into the knowledge held by the ‘crowd’. This includes the knowledge of residents, community-led planning groups, amenity societies, conservation bodies and built environment professionals, both in practice and retired.
CASA’s Jaimie Denholm, Research Associate on Colouring London, led the testing with a community group in Somers Town, Camden. “They have a lot of historical knowledge but not in academic form.”
For Denholm, this is the real potential of Colouring London: connecting people to the built environment around them and corralling all of this local knowledge into one place. Somers Town, a social housing development, has undergone huge changes over the past few decades, so Colouring London seemed like the perfect way to highlight its identity and heritage, and how to protect it.
“I have lived there my whole life,” says Denholm. “I studied at UCL and have been involved in public engagement and outreach before, so I have this dual role. I’ve been able to use the platform to introduce people to the concept of conservation areas and how you go about about proposing one. The platform is ideal for showing the historical significance of buildings.”
Citizens’ views on whether they think the building contributes to the city are also collected within the ‘Like me?’ section. This category is designed to assist London’s planning departments in harnessing difficult-to-access but important information on building performance, and to identify buildings that may be key socio-economic assets for local areas in future. It also enables the platform to begin to exploit the predictive ability of heritage and community planning groups, which in the 1960s and 1970s were to save, and foresee the socio-economic potential of now iconic, high-value areas of London, such as Covent Garden, Shoreditch, Whitehall and Bloomsbury.
“In some ways, locals can know a lot more about their buildings,” says Philip Steadman, Emeritus Professor of Urban Studies and Built Form Studies at the UCL Energy Institute. “What’s good about Colouring London is that it’s about engaging these individuals and organisations. Its success will depend on how well it is taken up, but I think the age data they have is very promising and much better than anyone else’s.”
Each core data category is accompanied by a brief explanation of why the data are needed, along with tips on sources for those wishing to help colour the maps in. Another of the project’s challenges is how to help users assess the reliability of data. For this Hudson says they are working to add a range of support features, including edit histories, sources and verification tools.
James Maddison, Consultant at the Open Data Institute, says that increasing access to data about London’s building stock has the potential to enable less energy usage and reduce climate change, and to lower the cost of living in London. It will be good to see the stories of how people are using this data to make citizens’ lives better, captured in Colouring London’s data.”
Building histories
Amy Spencer, historian at the Survey of London, part of The Bartlett School of Architecture, on the Survey's early collaboration with Colouring London and the potential for the project to influence its own work in the future.
The Survey has been involved with Polly Hudson’s research towards Colouring London from an early stage, and I’ve been excited to watch it develop over time. The team’s research in South-East Marylebone (published in two volumes in 2017) coincided with a small portion of Camden, which was the pilot area for Polly’s doctoral study. We were able to share data collected for South-East Marylebone, such as building dates, type and architect in gazetteer form. Our discussions with Polly then shaped the development of a database at the back-end of the Survey’s Whitechapel website (www.surveyoflondon.org), which has given us the ability to enter data about particular buildings from our research in the area. The Whitechapel project was a collaboration with CASA, and the website was developed by Dr Duncan Hay.
Data on buildings in the UK is highly fragmented, often inaccurate and sometimes restricted by public bodies. I think Colouring London will make a valuable contribution to research connected with the built environment, with the potential to provide accurate and complete data for citizens, historians and researchers in energy, infrastructure, planning, urban systems and geography – facilitating and strengthening important research in other areas.
We’re hoping that users will collect data from Survey of London volumes and upload it to Colouring London. This will open up our data (comprising anything from building dates to architects) to more people, and convert it into a format that will be useful to a wider range of researchers, including those using cutting-edge methods such as computing technology and mathematical analysis.
From my perspective, Colouring London will also be a valuable resource for the Survey. Our ‘Histories of Whitechapel’ project (funded by the AHRC) was an experiment in collaborating with the public, who contributed information, memories and images to enrich the Survey’s research on a complex and diverse part of London. In a similar way, data collected on Colouring London may help to give us an initial overview of particular areas to contribute to discussions about future study areas, and also feed into the Survey’s detailed research.
 The Bartlett is home to some of the most talented staff, students and alumni in the world, tackling some of the most urgent problems facing our planet, says Dean Christoph Lindner.