High throughput petrochronology and sedimentary provenance analysis by automated phase mapping and LAICPMS
Abstract
The first step in most geochronological studies is to extract dateable minerals from the host rock, which is time consuming, removes textural context, and increases the chance for sample cross-contamination. We here present a new method to rapidly perform in-situ analyses by coupling a fast Scanning Electron Microscope (SEM) with Energy Dispersive X-ray Spectrometer (EDS) to a Laser Ablation Inductively Coupled Plasma Mass Spectrometer (LAICPMS) instrument. Given a polished hand specimen, a petrographic thin section, or a grain mount, Automated Phase Mapping (APM) by SEM/EDS produces chemical and mineralogical maps from which the X-Y coordinates of the datable minerals are extracted. These coordinates are subsequently passed on to the laser ablation system for isotopic analysis. We apply the APM+LAICPMS method to three igneous, metamorphic and sedimentary case studies. In the first case study, a polished slab of granite from Guernsey was scanned for zircon, producing a 609 ± 8 Ma weighted mean age. The second case study investigates a paragneiss from an ultra-high pressure terrane in the North Qaidam terrane (Qinghai, China). 107 small (25 μm) metamorphic zircons were analysed by LAICPMS to confirm a 419 ± 4 Ma age of peak metamorphism. The third and final case study uses APM+LAICPMS to generate a large provenance dataset and trace the provenance of 25 modern sediments from Angola, documenting longshore drift of Orange River sediments over a distance of 1500 km. These examples demonstrate that APM+LAICPMS is an efficient and cost effective way to improve the quantity and quality of geochronological data.
Key points:
- We combine automated phase imaging (APM) by SEM/EDS with laser ablation mass spectrometry (LAICPMS)
- The new workflow produces paired mineralogical and isotopic datasets for hand specimens and thin sections
- APM+LAICPMS increases throughput of igneous, metamorphic and sedimentary studies
1 Introduction
Geology, like other fields of Science, greatly benefits from the ever increasing pace of
technological progress. Continuous improvements in the miniaturisation,
automation and affordability of mass spectrometers have provided geologists with
unprecedented access to precise chronological data, and have opened up new research
fields such as detrital geochronology. Nowadays, it is common for studies to
comprise thousands of U-Pb ages in dozens of samples, something that would
have been prohibitively expensive just a decade ago. In a parallel trend,
geochronological/isotopic data are increasingly combined with compositional
measurements (Engi et al., 2017). Similarly, sedimentary provenance studies
increasingly employ a combination of detrital geochronology, bulk geochemistry and
heavy mineral analysis (Vermeesch and Garzanti, 2015). Mineral separation is a
bottleneck that prevents these exciting new developments from being more widely
adopted.
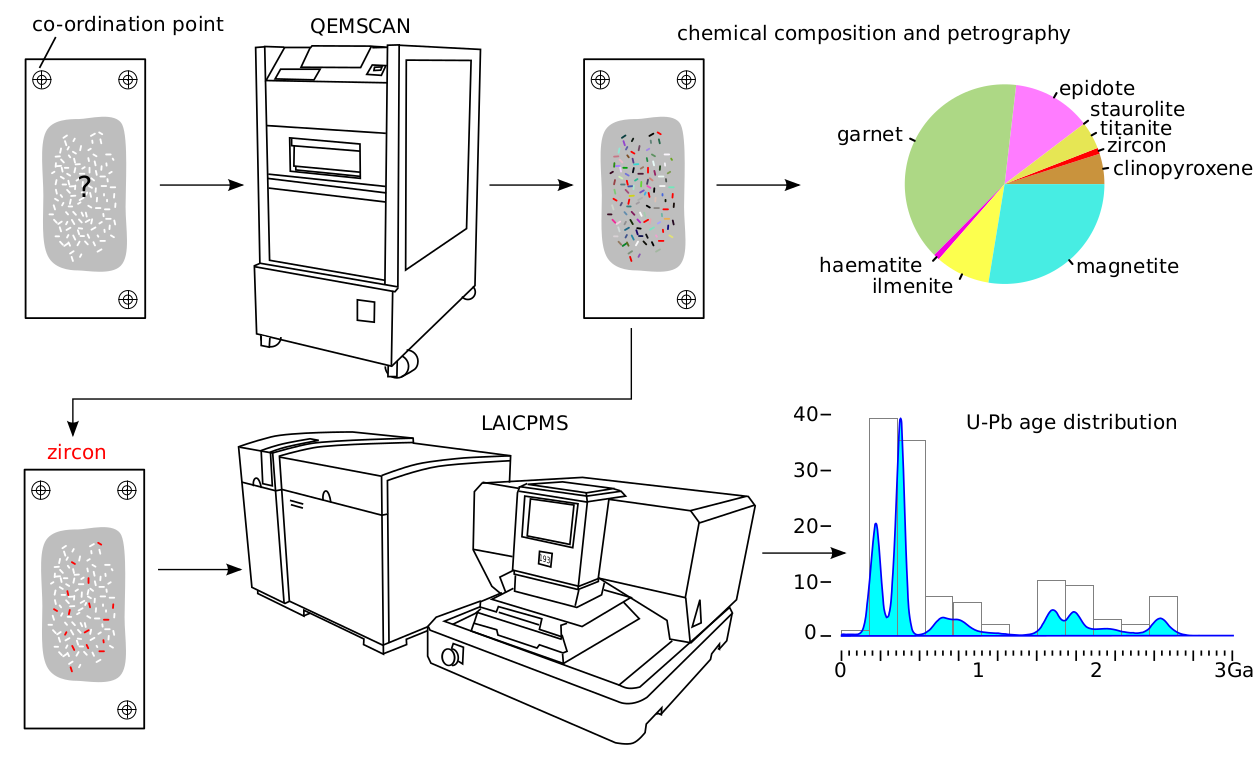
In stark contrast with the spectacular advances in mass spectrometery and computing, the procedures used to separate datable minerals such as zircon or apatite from the host rock have changed little over the past half century. These procedures typically involve physical disaggregation of the rock with hammers, jaw crushers and disk mills; submersion in one or two dense liquids such as bromoform, di-iodomethane or sodium-metatungstate; and magnetic separation. Not only is mineral separation an unpleasant and time consuming enterprise, it also destroys all textural information within a rock sample, increases the chance for sample cross-contamination and may introduce bias (Sircombe and Stern, 2002). For example, small zircon inclusions in other minerals such as biotite or garnet, which may contain key petrological information, will generally be removed by magnetic and density separation techniques. We here present an integrated suite of software and hardware designed to overcome all these problems. The new workflow combines an SEM/EDS Automated Phase Mapping (APM) system with an LAICPMS system in order to extract both chemical and isotopic information from rocks while eliminating or reducing the need for manual mineral separation. The APM+LAICPMS workflow comprises of three steps:
- APM is applied to a polished and carbon-coated sample surface to find all occurrences of the mineral of interest in it.
- The centre point locations of a random subset of these datable grains are extracted and their coordinates are converted into a format that can be read by the laser ablation system.
- The selected grains are analysed by LAICPMS to determine their isotopic composition and, hence, age.
Neither the combination of SEM/EDS with in-situ geochronology, nor the application of in-situ U-Pb dating to thin sections, is new. Previous studies have developed similar approaches to those described in this paper in order to obtain contextual information that would be destroyed by mineral separation, or to overcome severe sample size limitations (e.g., Compston et al., 1984; Simonetti et al., 2006). The APM+LAICPMS approach achieves those same goals, but is also motivated by other factors, namely speed and convenience. Both the QEMSCAN© SEM/EDS system and the quadrupole LAICPMS instrument used in this study are optimised for speed. They produce chemical maps and isotopic compositions faster than any other common technology available today. When used in tandem, they open the door to a host of new and exciting applications. Although ongoing improvements in mass spectrometry and computing technology have resulted in amazing gains in precision and accuracy of geochronological data (e.g., Kuiper et al., 2008; Schmitz and Kuiper, 2013), it may be argued that for some Earth Sciences applications, the current precision and accuracy of geochronological methods are already fit for purpose. In many studies, what is needed is not so much better data, but just more data. The new analytical workflow remove most manual steps in the data generation process whilst providing valuable compositional and textural information. This will be illustrated with three simple case studies in igneous (Section 3), metamorphic (Section 4) and sedimentary (Section 5) geology.
2 Methods
2.1 Sample preparation
The analysed materials may consist of a standard grain mount, a polished thin section or a hand specimen (Figures 2.a, 3.a and 5.a). Further preparation details about these are provided in Sections 3, 4 and 5. The only limitations are the size of the SEM and LAICPMS sample trays. For very homogeneous samples, it is useful for three copper tape markers to be attached to the corners of the samples, to serve as reference points for re-coordination. Alternatively, marker points can also be created by laser ablation, or one can simply use any easily recognisable sample feature. Carbon coating is applied prior to SEM/EDS analysis, and rubbed off prior to LAICPMS analysis.
2.2 SEM-EDS automated phase mapping
The APM in this study was performed on a QEMSCAN© (‘Quantitative Evaluation
of Minerals by SCANning electron microscopy’) ‘Wellsite’ instrument. This is a high
throughput SEM developed by CSIRO and marketed by FEI® Inc. (Sutherland and
Gottlieb, 1991; Khosa et al., 2003; Allen et al., 2012). The Back-Scattered
Electron (BSE) signals and Energy-Dispersive X-ray Spectra (EDS) collected by a
QEMSCAN instrument are compared with a database (Species Identification
Protocol – SIP) of known materials to determine the chemical and mineralogical
composition of samples at high speed and precision. Typical processing speeds
are 0.5-2 cm2 h-1 at 10 μm spatial resolution (which can go down to 1 μm),
depending on whether crystalline rock or grain mounts are analysed. This
allows 3-15 samples to be processed per day, depending on the application.
Post-processing of archival datasets produces a wealth of additional information that
is difficult to obtain using conventional techniques. The software can assess
mineral grain sizes and shapes. For whole-rock samples, textural information
and grain orientations can be extracted. Mineral associations, inclusions
and their host minerals, and types of lithic clasts are valuable additional
information that is difficult and time-consuming to obtain by conventional
methods.
The present study was performed with a QEMSCAN instrument, but many other APM instruments can be combined with LAICPMS as well. Examples of this include the TIMA (TESCAN), MinSCAN (Zeiss), INCAMineral (Oxford Instruments), RoqScan (CGG), and the free iSpectra software, which can be installed on a wide range of ‘ordinary’ SEM equipped with an EDS detector (Liebske, 2015). Raman spectroscopy is a different option, based on crystallographic structure rather than chemical composition, that holds great promise for the identification of heavy minerals in sediments (Andò and Garzanti, 2014). While SEM-based methods such as QEMSCAN can easily distinguish different chemical compositions in similar minerals and even amorphous matter, but do not recognise crystal structure, Raman is able to distinguish chemically identical polymorphs. But like SEM/EDS, the accuracy of Raman classification is only as good as that of the underlying mineral database. Different instrumental implementations of QEMSCAN and some of the previously mentioned alternatives offer the option to combine EDS and Raman spectroscopy, potentially combining the strengths of both approaches.
2.3 LAICPMS
Zircon age measurements were performed using an NWR193 laser ablation system coupled to an Agilent 7700x quadrupole ICPMS. Stage coordinates were converted from the QEMSCAN output format to the NWR193 laser stage input format by an in-house computer code called CoCo (which stands for Coordinate Converter1). The conversion requires the identification of three marker points, which can either be copper markers or any other recognisable sample feature. Vertical focus was verified by manually going through the selected grains and adjusting the z-position if necessary. Ablation was done using a 25 μm spot size, 11 Hz repetition rate and an energy fluence of ca. 2.5 J/cm2. Mass spectrometer measurements included a 15 second blank measurement followed by 25 seconds of ablation and 22 seconds of washout time. The first two seconds worth of ablation signal were discarded to remove any surface-adsorbed common Pb. Integration times were set to 0.05 ms for masses 29 and 91, 50 ms for mass 206, 120 ms for masses 207 and 208, and 20 ms for masses 232 and 238. The entire analytical process is highly automated, allowing us to run the ICPMS overnight and date up to 1000 zircon grains per analytical session at a rate of ca. 100 dates per hour. In our experience, long analytical sessions often yield better analytical results than short ones, because they ensure that the ICPMS is operated under stable conditions. These long sessions require extraordinary spatial repeatability (<5 μm) of the laser ablation stage. This stability is achieved using the ImageLock image recognition function that has recently been added to the NWR193 software. Age calculation followed a standard-sample bracketing approach in which two Plešovice zircon analyses (TIMS reference age 337.13 ± 0.37 Ma; Slàma et al., 2008) were interspersed between every 50 measurements (Jackson et al., 2004). Additionally, NIST SRM612 silicate glass (Jochum et al., 2011) was analysed to monitor sensitivity and quantify the U and Th concentrations of the samples. The stage coordinates of the reference materials were set manually. Instrumental mass bias and depth-dependent elemental fractionation of Pb, Th and U were corrected using Glitter 4.4 (Griffin et al., 2008). The calculated 206Pb/238U age was used for grains younger than 1100 Ma, and the 207Pb/206Pb age for older grains. Grains with a complex growth history or disturbed isotopic ratios, with greater than +5/-15% discordance, were rejected. A common lead correction was applied for the igneous and metamorphic samples, using 207Pb instead of 204Pb due to the unresolvable 204Hg interference on the latter isotope. The radiogenic 207Pb/206Pb- and 207Pb/238U-ratios were obtained by projecting the measured ratios onto the Tera-Wasserburg concordia line along a line going through the common 207Pb/206Pb-ratio. The latter was obtained by isochron regression through multiple aliquots (igneous case study, Section 3), or from the Stacey and Kramers (1975) crustal evolution model (metamorphic case study, Section 4).
3 Application to igneous petrochronology
Igneous rocks are, in many ways, ideally suited for radiometric geochronology. First, they often contain abundant datable minerals. In the case of acidic to intermediate lithologies, this is typically zircon, the mineral of interest in the present study. Second, the interpretation of igneous ages is generally straightforward, as isotopic closure of igneous minerals tends to coincide with their formation. Third, unlike sedimentary rocks, isotopic data from multiple analyses of igneous minerals can be combined into an isochron or weighted mean, resulting in internal quality checks and higher precision. Sample size requirements for igneous rocks are often an order of magnitude lower than for sedimentary rocks. This makes the overhead of mineral separation all the more unreasonable. It seems wasteful to spend a full day to separate 10,000 zircons from an igneous rock sample, only to use a dozen or so for mass spectrometry. The APM+LAICPMS workflow alleviates this concern and has allowed the London Geochronology Centre (LGC) to pursue studies that would previously have been deemed too costly. One illustrative example of such a study was conceived by an amateur geologist (Mr. D. Smith) from Guernsey who approached the LGC with a request to date some regionally important igneous rocks. With no access to mineral separation facilities and no funds to pay for the analyses, this request would normally have been turned down. However, the efficient workflow tipped the balance in favour of scientific curiosity, and the results of this small study are discussed in this section.
3.1 L’Erée granite (Guernsey)
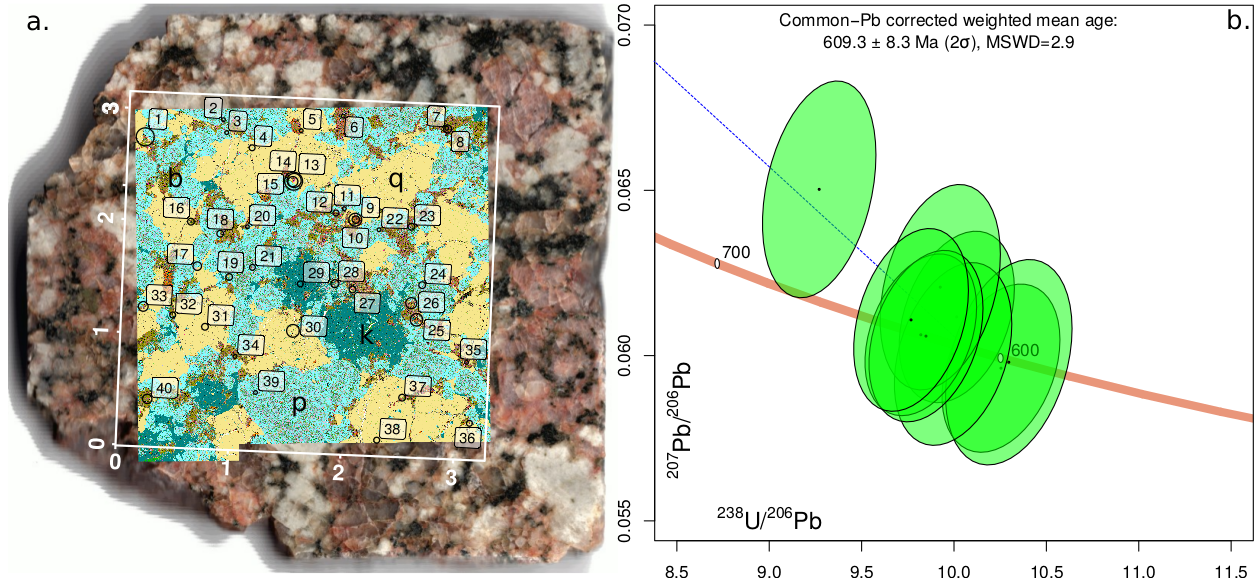
Guernsey is one of the Channel Islands, located off the French coast between Normandy and Brittany. The geology of this small island is very diverse. Its southern half is dominated by high grade metamorphic basement rocks (Icart orthogneiss) of Palaeoproterozoic age, intruded by the Perelle diorite, which was foliated during the Cadomian (late Neoproterozoic) Orogeny. Igneous rocks found further north cover the entire range from gabbro to granite (Topley et al., 1990). The British Geological Survey last visited Guernsey 40 years ago and relatively little geological research has been carried out on the island since then. The geological and tectonic history of Guernsey is commonly assumed to match that of the French Northern Armorican Massif (FNAM, D’Lemos et al., 1990). However, tectonic reconstructions by Linnemann et al. (2014) suggest that the Cadomian suture zone may separate Guernsey from the FNAM, implying completely different pre-Cadomian geologic histories between both terranes. The few geochronological constraints on Guernsey include a single zircon U-Pb age of 2061 ± 2 Ma for the Icart orthogneiss (Samson and D’Lemos, 1998), a 611 Ma ± 0.5 Ma zircon U-Pb age for the Perelle diorite (Samson and D’Lemos, 1999), a handful of biotite and hornblende 40Ar/39Ar ages (565-605 Ma, Dallmeyer et al., 1992) and a single whole rock Rb/Sr isochron (469 ± 13 Ma, D’Lemos, 1987) for gabbros and diorites of the Northern Igneous Complex. For this study, we analysed a previously undated granite sample from the L’Erée granite (49.45∘ N, 2.65∘ W). Sample preparation was done by a stone mason on Guernsey and consisted of cutting and polishing a 50 × 50 × 6 mm slab of rock. This small tile was shipped to London and analysed by APM+LAICPMS.
3.2 Results
SEM/EDS phase mapping of the polished tile confirms the granitic lithology of the L’Erée intrusion. Based on a 3 × 3 cm area scanned at 10 μm resolution for a duration of 9 hours, the sample contains 32.5% (by area) quartz, 27.2% plagioclase feldspar, 9.0% alkali feldspar, 7.8% micas and chlorite and 8.7% clay minerals (Figure 2.a). Note that these modal abundances are measured over a comparatively small area and may not be representative of the bulk rock due to the coarse grain size of this sample (Figure 2.a). Accessory minerals include 0.26% apatite and 0.01% zircon, with grain sizes of up to 4900 μm2 (corresponding to an equivalent circular diameter of ca. 80 μm). The X-Y coordinates of 40 of these grains (>400 μm2) were passed on to the LAICPMS system and dated using the U-Pb method. 33 of these zircons yielded U-Pb isotopic data. This was further narrowed down to 9 dates by visual inspection of the time-resolved ICPMS signals for evidence for overpolishing, which causes the laser beam to drill through grains during the ablation process. Plotting the concordant data on a Tera-Wasserburg diagram yields a common-Pb corrected weighted mean age of 609.3 ± 8.3 Ma (Figure 2.b). This value confirms that the L’Erée granite was emplaced during the late Proterozoic Cadomian orogeny, roughly coeval with the Perelle granodiorite. More information could be gleaned from the sample by acquiring additional data (e.g. CL-imagery), or using multi-collector mass spectrometry (e.g. including a 204Pb-based common Pb correction). But the key point made by this case study is that the L’Erée granite would have remained undated if it were not for the low cost (in terms of staff time and consumables) of the APM+LAICPMS workflow.
4 Application to metamorphic petrochronology
Metamorphic minerals and textures provide valuable information about geological processes occurring in the crust and upper mantle. By tying together the experimentally determined stability field of metamorphic index minerals with geochronological information obtained from minerals such as zircon, monazite or K-bearing micas, it is possible to reconstruct P-T-t (pressure-temperature-time) paths and thereby track vertical motions through the lithosphere. This in turn provides valuable constraints on tectonic rates and orogenesis. It is worth emphasising that textural and compositional information is crucial in these studies. Using the principle of superposition, the timing of (prograde, peak and retrograde) regional metamorphism can be bracketed by U-Pb dating of inclusion-bearing zircons and zircon inclusions in metamorphic minerals (e.g., Katayama et al., 2001; Liu and Liou, 2011). In this context, the combination of electron microscopy and laser- or ion-microprobe geochronology has proved invaluable (Schaltegger et al., 1999). The new APM+LAICPMS instrument suite makes this powerful combination of methods both faster and more convenient.
4.1 UHP paragneiss from Qaidam (China)
The discovery of coesite in metamorphic rocks from the Western Alps and Norway by
Chopin (1984) and Smith (1984) marked the beginning of Ultra High Pressure
(UHP) metamorphism research. Coesite is only stable at pressures of greater than 30
kbar, indicating that these rocks had been buried to depths of greater than 90 km
(assuming lithostatic conditions). This is far greater than geologists previously
thought possible. The discovery of metamorphic diamonds in Kazakhstan by Sobolev
and Shatsky (1990) pushed the limits of orogenic metamorphism further to 40 kbar,
or more than 120 km depth (again assuming lithostatic pressure). This means that
continental subduction can bury crustal rocks well into the mantle, and these can
resurface rapidly enough to retain their characteristics, thus placing important
constraints on tectonic processes. The discovery of metamorphic coesite
and diamond sparked a global search for these minerals. The north Qaidam
terrane is one area in which UHP metamorphism has been confirmed (Song
et al., 2003; Mattinson et al., 2007). UHP minerals are often found in relatively
small eclogite and peridotite ‘rafts’ contained within volumetrically dominant ortho-
and paragneisses. These gneisses may have provided the buoyancy required to lift the
dense ultramafic UHP lithologies out of the mantle (Hacker et al., 1995).
Although the gneisses do not always contain UHP minerals themselves due to
retrograde metamorphism, they do tend to be much richer in datable minerals
(notably zircon) than the eclogites and peridotites. These minerals put key
constraints on the timing of peak UHP and retrograde metamorphism (Mattinson
et al., 2009).
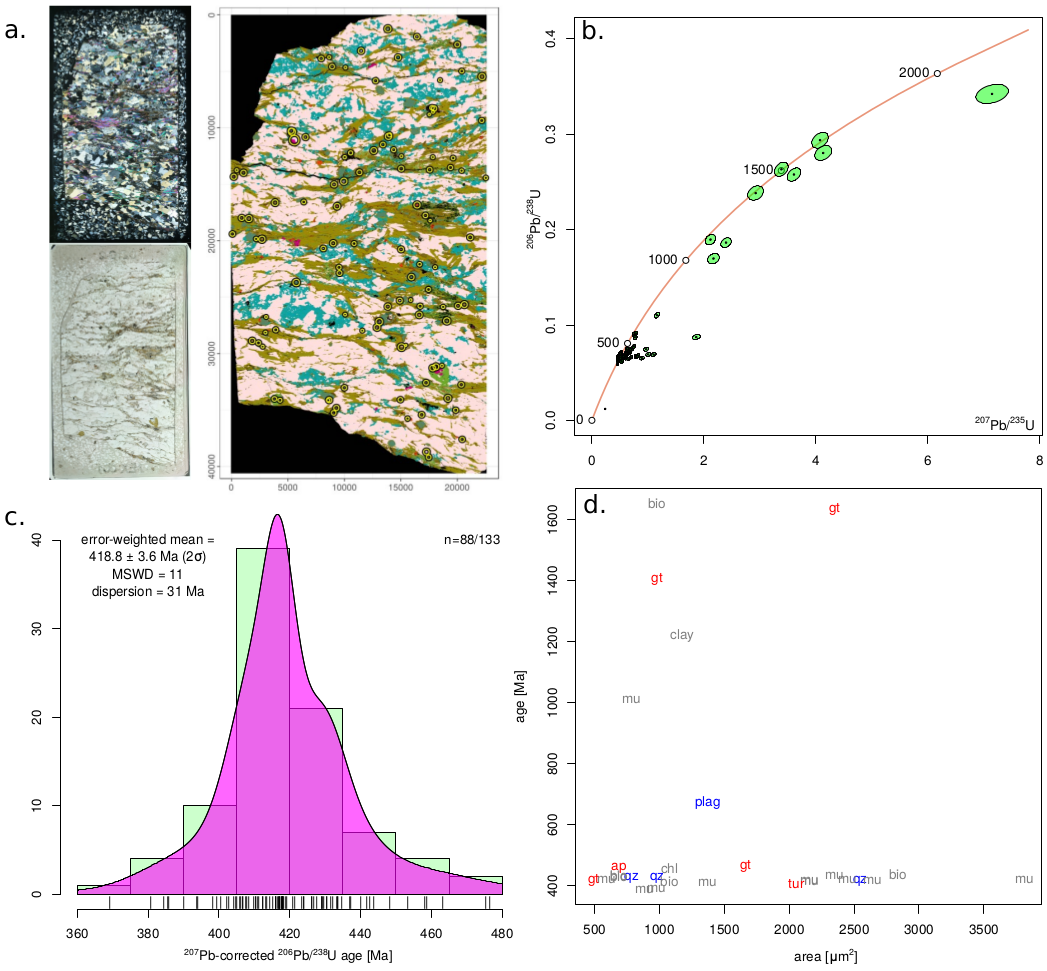
We have re-analysed a paragneiss sample (D21G-2) from the north Qaidam terrane that was previously studied by Mattinson et al. (2009). Zircons from this sample were originally analysed by electron microprobe, cathodo-luminescence imaging and SIMS U-Pb dating. This revealed two distinct zircon age components. The first component contains 1.8-2.5 Ga detrital ages inherited from the sedimentary protolith of the paragneiss. This component is predominantly found in the cores of the zircons. The second component is found in some rims and is much younger, with dates ranging from 390-450 Ma and a concordia age of 426 ± 4 Ma (Mattinson et al., 2009). This date marks a phase of syn-metamorphic overgrowth during peak metamorphism. Unlike the igneous rock sample in the previous section, the metamorphic rock sample was not introduced into the QEMSCAN as a hand specimen but as a polished thin section (Figure 3.a).
4.2 Results
SEM/EDS phase mapping shows that sample D21G-2 contains (in decreasing order of abundance) quartz, feldspars, muscovite, biotite, chlorite, garnet, tourmaline, alumino-silicates, apatite, rutile and zircon (Table 1). 107 of these zircon grains were sufficiently large (400-12 000 μm2) for U-Pb dating. 40 of these grains were enclosed by a single mineral in cross section. Garnet only makes up 2.4 % of the whole rock, but hosts 20 % of the completely enclosed zircon grains. Similarly, 55 % of these zircons are hosted by mica, which only makes up 24 % of the whole rock. Thus, a disproportionately large number of zircon grains are found in garnet and mica, with quartz and feldspar containing far fewer zircons (Table 1). The U-Pb data reveal two distinct zircon populations. 12 % of the grains (13/107 zircons) yield Proterozoic (1-2.5 Ga) U-Pb-ages (Figure 3.b). These are inherited grains from the sedimentary protolith to this paragneiss. The remaining 88 % of the zircon grains cluster between 390 and 500 Ma. This population represents the syn-metamorphic component. Plotting the common-Pb corrected 206Pb/238U-dates (using the two-stage crustal evolution model of Stacey and Kramers, 1975) as a Kernel Density Estimate (KDE, Vermeesch, 2012) constrains the timing of syn-metamorphic zircon growth to 400-440 Ma with an error-weighted mean of 419 ± 4 Ma, in good agreement with the results obtained by Mattinson et al. (2009) (Figure 3.c). The mineral affinities produced by the SEM/EDS phase mapping allow further inspection of the U-Pb results. Figure 3.d simultaneously plots zircon U-Pb age against grain size and mineralogy. This is a potentially very useful way to constrain crystallisation histories, albeit one that does not yield any noticeable patterns in sample D21G-2, as there is no discernable difference in the zircon U-Pb ages for the different host minerals. Using the principle of superposition, this observation supports the notion that zircon growth preceded or accompanied the formation of the other minerals in the sample.
| mineral | whole rock | zircon |
| feldspar | 14.1 | 2.5 |
| garnet | 2.4 | 20 |
| mica | 24 | 55 |
| quartz | 55 | 12 |
| rutile | 0.17 | 2.5 |
5 Application to sedimentary provenance analysis
Sediments and sedimentary rocks, though globally insignificant from a volumetric point of view, nevertheless are the subject of much geological research, because:
- They cover an estimated 66% of the Earth’s surface including nearly all agricultural and urban areas (Blatt and Jones, 1975).
- They represent a valuable archive of geological and environmental change, which is key to reconstructing the geologic history of our planet.
- Sedimentary basins form the source and reservoir of most hydrocarbon resources.
Siliciclastic sediments are, by definition, associated with mass transport of Earth materials. The issue of provenance is therefore central to understanding sedimentary environments. Provenance may be traced by ‘fingerprinting’ sediments through chemical, mineralogical or isotopic means. Conventionally, each of these provenance proxies are characterised on separate aliquots of the same samples. For example, the chemical composition of the bulk sample may be analysed by X-ray fluorescence (XRF) on one aliquot, framework petrography on another, heavy mineral analysis on a density separate of a third split, and zircon U-Pb dating on a further density separate of the heavy mineral fraction. The labour intensity of this procedure holds back the widespread application of multi-method provenance studies (Vermeesch and Garzanti, 2015). The new APM+LAICPMS instrument suite aims to solve this problem by potentially generating all four aforementioned provenance datasets as part of the same workflow. When APM is performed to locate zircons in a sediment grain mount, it produces compositional and mineralogical data as byproducts (Figure 1). We will illustrate this procedure with a large scale provenance study of modern sands from Angola.
5.1 Modern sand from Angola
The Angolan coast stretches from the Cunene River in the south to the Congo River
in the north. Spanning over 11 degrees of latitude, it is characterised by hyperarid
conditions near the border with Namibia (17∘S) to humid conditions near the
border with the Democratic Republic of Congo (6∘S). The geology consists of
Palaeoproterozoic basement rocks in the southern and central parts, and
metamorphic terranes of Neoproterozoic age in the north. The topography consists of
a coastal plain that widens from 100 km in the south to 200 km in the north, and a
steep escarpment to the east of this that rises to a ~1500 m high plateau. Most
Angolan rivers flow towards the Indian Ocean, with only the Cunene (11×104 km2
catchment area) and the Cuanza (15×104 km2 catchment area) carrying significant
amounts of water to the Atlantic Ocean. Atmospheric circulation along the
southwest African margin is dominated by the southeasterly trade winds. These
winds drive powerful long-shore drift currents that carry sediments from the
Orange River in South Africa to the Namib and Skeleton Coast sand seas in
Namibia, and into the Moçâmedes Desert of southern Angola (Vermeesch
et al., 2010; Garzanti et al., 2012, 2014, 2017). Further offshore, the Benguela
Current carries cold Antarctic waters northwards until 14-16∘ latitude, where the
Benguela meets the warm Angola Current and veers offshore (Meeuwis and
Lutjeharms, 1990).
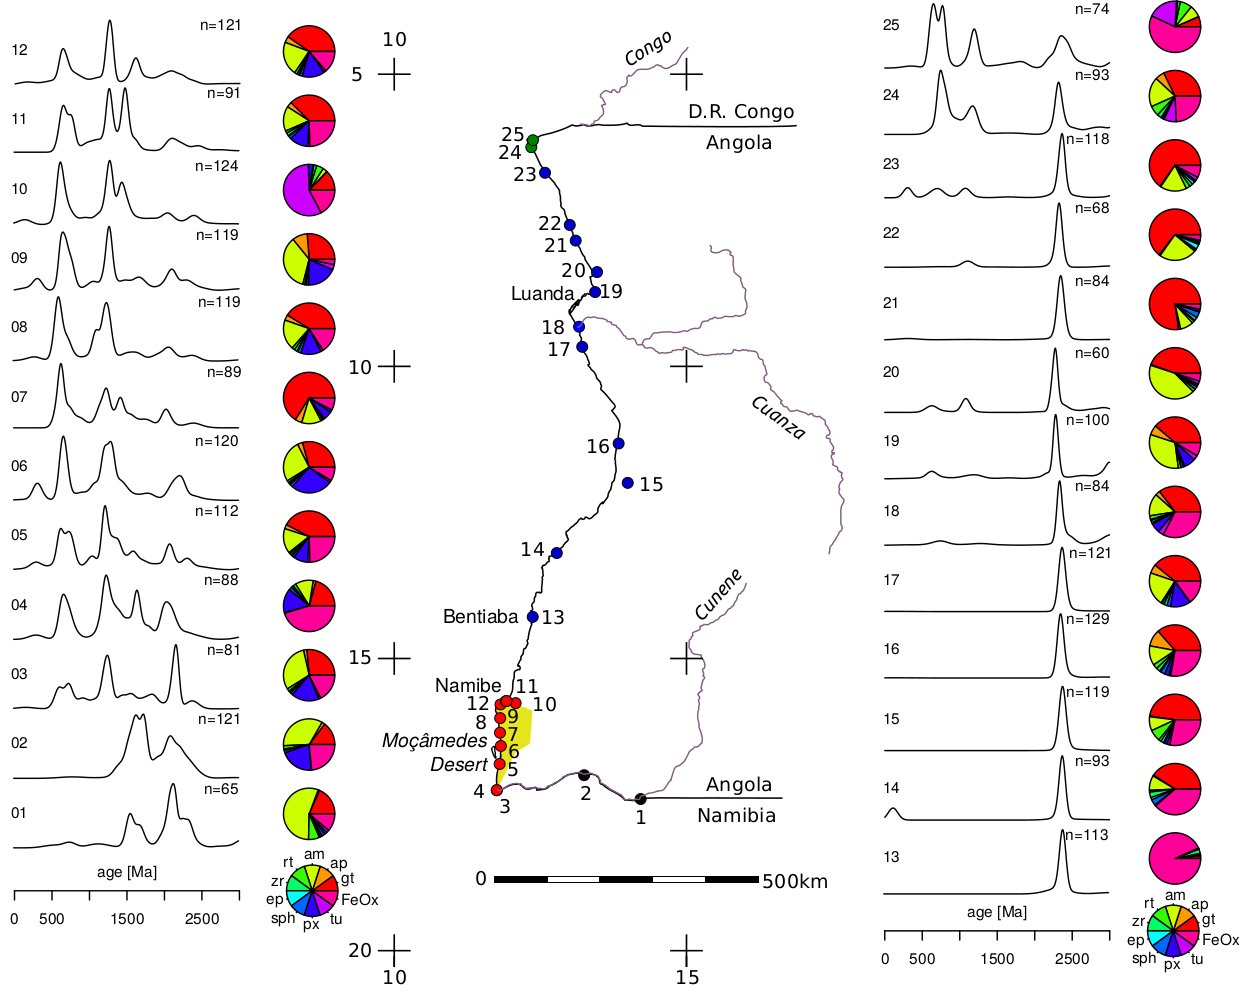
The purpose of the third case study was to determine how far north Orange River sediment is carried by longshore currents. To this end, 25 samples were collected along the Angolan coast during a single field expedition in June 2015. The sample set comprises of two Cunene River samples (labeled 01 and 02 in Figure 4), ten samples from dunes and beaches in the Moçâmedes Desert (03-12), and thirteen beach and river samples along the rest of the Angolan coast, up to the Congo River mouth. From the 32-500 μm fraction of each sample, heavy minerals were separated by centrifuging in sodium metatungstate (density ~2.90 g/cm3), and recovered by partial freezing with liquid nitrogen. One split of these separates was analysed by conventional heavy mineral analysis, using methods described by Garzanti et al. (2012). A second split was mounted in epoxy resin on glass slides, polished, carbon coated and analysed by SEM/EDS. After scanning, the CoCo software re-coordinated all the zircon grains in each sample. If more than 130 zircon grains were visible in the grain mount, then a random subset of these were selected by the CoCo software (Figure 5.a). For samples containing fewer than 130 zircons, all datable grains were analysed.
5.2 Results
The most abundant heavy minerals are Fe-Ti-Cr oxides, amphibole, epidote,
pyroxene, garnet and zircon. The relative abundances of these minerals vary greatly
between samples as a result of the combined effects of provenance and hydraulic
sorting (Garzanti et al., 2017; Vermeesch and Garzanti, 2015). Sample 13
in particular is a placer deposit whose heavy mineral composition consists
of nearly pure Fe-Ti-Cr oxides (Garzanti et al., 2017). The transparent
heavy mineral composions exhibit similar degrees of variability. For example,
sample 01 is dominated by amphibole and contains little pyroxene, whereas
sample 10 contains a lot of pyroxene but virtually no amphibole. This variability
provides an opportunity to compare and contrast the SEM/EDS results with a
conventional heavy mineral analysis. To this end, >200 transparent heavy-mineral
grains were either counted under the microscope by the area method or
point-counted at suitable regular spacing to obtain real volume percentages
(Chayes, 1956a; Galehouse, 1971). Figure 5.b compares the resulting modal
estimates of the most abundant transparent heavy mineral (amphibole) with those
obtained by the SEM/EDS phase mapping. The agreement can only be described as
fair (correlation coefficient of 0.76). This likely results from a combination of
geometrical and compositional factors that will be discussed in more detail in
Section 6.
All samples yielded at least 60 concordant U-Pb ages (using a 15% discordance
filter), ensuring with 95% confidence that we have sampled all fractions exceeding
8.5% of the total population (Vermeesch, 2004). Wetherill concordia plots of all
samples are presented in the Supplementary Information. The detrital zircon U-Pb
age spectra fall into four geographical classes: Cunene, Moçâmedes, Central Angola
and Congo. The Cunene River samples (01 and 02) contain two components at 1300
and 1700 Ma, respectively. Moçâmedes samples (03-12) exhibit a broader and more
complex spectrum with dates ranging from 500 to 2000 Ma. These spectra look
similar to those obtained from modern sand in the Namib and Skeleton
Coast deserts, and the Orange River as reported by Vermeesch et al. (2010)
and Garzanti et al. (2012, 2014). The Orange signal continues until the
town of Namibe at the northern border of the Moçâmedes desert. The next
sample, collected 100 km further north in Bentiaba, has a completely different
U-Pb age spectrum that consists of a single, Eburnean age component at
~2100 Ma. Our data demonstrate that longshore drift of Orange River sediment
terminates some 1500 km north of the Orange River mouth. Thus the offshore
extension of southern Africa’s largest river is nearly as long as its onshore
course.
The Eburnian age spectrum is found all along the rest of the Angolan coast (samples 03-22) over a distance of over 1000 km. It is only a few tens of kilometres south of the Congo River mouth (samples 24 and 25) that the spectrum changes again, to a mixture of four components at 700, 1000, 2100 and 2800 Ma. Joint analysis of all the U-Pb data by Multidimensional Scaling (MDS) confirms the segmentation of the Angolan coast into four zones. MDS is a statistical technique that produces ‘maps’ in which similar samples plot close together, and dissimilar samples plot far apart (Vermeesch, 2013). Using the Kolmogorov-Smirnov statistic as a measure of dissimilarity, the MDS configuration of Figure 5.c groups the samples into four clusters that have a one-to-one correpondence with the sampling locations (Cunene, Moçâmedes, Central Coast and Congo). The comparatively large spread of the Central Coast samples (shown in blue) reflects the high sensitivity of the Kolmogorov-Smirnov statistic to unimodal age distributions. For such distributions, even the slightest shift in the median age will have a large effect on the KS statistic. In contrast, the KS-statistic is relatively insensitive to differences in the tails of complex age distributions and does therefore not easily differentiate between the different samples within the Moçâmedes cluster.

6 Discussion and Conclusions
Extracting or locating dateable minerals is the biggest bottleneck in many
geochronological studies. By reducing or entirely removing this bottleneck, the
APM+LAICPMS workflow has more than tripled the throughput of the U-Pb
operations at University College London, allowing the lab to process up to 5
samples and 700 zircon dates per day. Detrital samples generally do not
contain sufficient zircon in thin section, and generally still do require mineral
separation. However, this is only an abbreviated version of the mineral separation
normally employed for zircon. So even though this study uses mineral separates,
the process is faster and less toxic than a full separation to concentrate
zircon to good purity as would conventionally be done. Furthermore, because
zircon does not form a solid solution series, EDS phase mapping is nearly
100% efficient at finding zircon in grain mounts. Hence, small and/or crude
mineral separates do not pose a problem. The high-throughput approach to
mineral separation described in Section 5 enables significant time savings
compared to conventional mineral separation. The increased throughput means
allows more samples to be analysed for any given provenance study. The
resulting ‘big’ datasets offer much greater power to resolve the sometimes
subtle differences that can exist between age distributions (e.g., Rittner
et al., 2016).
In igneous petrology, the APM+LAICPMS workflow avoids even more manual
work. In this case, sample preparation is limited to simply polishing a hand
specimen, and LAICPMS analysis requires only a dozen or so datable crystals to be
found. The resulting gain in throughput would be very advantageous in the case of
reconnaissance studies on the one hand, and studies where large numbers of different
samples need to be analyzed on the other. It is now widely recognized that many
plutons have a complex architecture (Krauskopf , 1968) and are assembled over
measurable time intervals (Matzel et al., 2006). The new approach opens the door to
high (map-scale) resolution ‘age mapping’ of igneous bodies. For example, working on
some Cascades batholiths, Matzel et al. (2006) found 3-5 Myr assembly
timescales, interspersed with shorter magmatic pulses, based on detailed
TIMS work on 8-12 samples per pluton. Assuming sufficient precision of the
LAICPMS measurements, the new method would make practical analysis of many
dozens of samples distributed across the batholith, and the SEM/EDS phase
mapping would also generate compositional/mineral assemblage information as
well.
In some cases, the APM+LAICPMS approach does not just produce more data,
but also improves their fitness for purpose. The use of software such as CoCo to
automatically pick a random selection of (detrital) zircon grains largely removes the
selection bias that human operators inevitably carry. The Angolan samples
yielded many dark anhedral grains that would never have been analysed by
a human operator, but were marked as zircons on the SEM/EDS phase
maps. These grains always did turn out to be zircons, many of which yielded
concordant U-Pb dates. In igneous studies, significant gains in precision
can be made by averaging multiple grains. This may be used to offset any
loss of age precision resulting from small laser spot sizes, or from analysing
a full suite of trace elements during ICPMS analysis. Thus, the increased
throughput of the new workflow may significantly increase the scope of what
can be analysed. Data quality would be further improved by integrating
CL-imaging in the analytical workflow. Unfortunately this was not possible using
the ‘Wellsite’ version of the QEMSCAN instrument used for this study.
Other automated SEM-EDS phase imaging systems do allow CL-imaging
of samples, which yields additional textural information for zircon U-Pb
analysis. This is essential for complex igneous and metamorphic samples that
contain multiple phases of zircon growth. However, in some sedimentary
provenance studies the actual ages do not matter so much as the shape of the
age spectra, which can be used as a ‘fingerprint’ to trace the flow of sand
through a sediment routing system (e.g., Garzanti et al., 2012, 2014; Rittner
et al., 2016; Vermeesch et al., 2010; Vermeesch, 2013; Vermeesch and
Garzanti, 2015). In such cases it is arguably better to place the laser spot ‘blindly’ so
as to avoid selection bias between cores and rims. CL-imaging is time consuming
but could be integrated in an automated workflow, by targeting a subset
of the imaged mineral phases after APM and before LAICPMS analysis.
Metamorphic and (particularly) igneous studies generally require far fewer
zircon U-Pb dates than sedimentary provenance studies do, so the additional
time for CL imaging would be modest and would be counterbalanced by the
reduction in the number of mixed analyses that need to be rejected during data
processing.
Although this paper has focused on zircon, SEM-EDS phase mapping can
identify other accessory minerals amenable to U-Pb geochronology, such
as apatite, titanite, rutile, monazite etc. This opens up the possibility of
acquiring detailed P-T-t paths in metamorphic petrology or multi-proxy detrital
datasets without mineral picking (e.g., O’Sullivan et al., 2016). Applying
U-Pb geochronology in thin section and polished hand specimen can also be
used to constrain the Pb initial ratio in common Pb-bearing phases such as
apatite, rutile or titanite using the Pb-composition of adjacent feldspars (Chew
et al., 2011). Finally, the ability to map accessory mineral occurrence inside
rock-forming minerals could be used to constrain the crystallysation and cooling
history of individual clasts in a conglomerate generating rich provenance
datasets.
Despite all these strengths, it is important to also be aware of the limitations of the APM+LAICPMS workflow. First of all, the accuracy of the compositional maps produced by the SEM/EDS instrument is only as good as the compositional database behind the software. Out of the box, SEM/EDS may struggle to correctly identify solid solution series minerals such as amphibole, pyroxene or garnet, and chemically variable minerals such as tourmaline (Nie et al., 2013). This may partly be the reason for the relatively poor agreement between the SEM/EDS and conventional heavy mineral abundances shown in Figure 5.b. The other likely reason for the observed scatter is the fact that conventional heavy mineral analysis is based on observations made by looking through a grain mount in transmitted light. Thus, the resulting mineral abundances are effectively done based on the 2D projection of the entire grain on to the focal plane of the petrographic microscope (Chayes, 1956b). In contrast, SEM/EDS uses carbon coated polished sections which are, essentially, 2D cross sections through a 3D lattice of grains (in case of hand specimens or thin sections), or through loose sediment in an epoxy puck or grain mount. In the latter case, the mineralogical composition may differ depending on grain size and the depth of the polish. This is due to the hydraulic equivalence between fine grained dense minerals and coarser grained light minerals (Garzanti et al., 2008), which makes the latter more (or, for epoxy pucks, less) likely to be overpolished than the former. Neither grain size nor polishing depth were controlled in the Angolan case study. Further work needs to be done to understand these issues and demonstrate the reliability of heavy mineral counts produced by SEM/EDS.
7 Conclusions
We here presented a novel workflow for high throughput petrochronology, combining automated phase mapping by high speed SEM/EDS with isotopic measurements by quadrupole LAICPMS. We successfully applied the new workflow to igneous, metamorphic and sedimentary samples. The igneous study took 12 hours to complete, including including 30 minutes to cut and polish the hand specimen, 30 minutes for re-coordination, 9 hours for the (overnight) APM analysis, and 30 minutes of LAICPMS time. The main limitation of the igneous study was the low yield of high quality U-Pb ages, which was caused by the tendency of the laser beam to drill through, or partially fall outside small or overpolished zircon crystals. The metamorphic case study was performed on a polished thin section. Since thin sections are needed for petrographic purposes anyway, the only additional sample preparation step was the application and removal of the carbon coating before and after APM analysis, respectively. One potentially very useful application of the new analytical approach is investigating the association of age compontents within the mineralogical context. The most significant limitations of our metamorphic study were the absence CL-images to guide the placement of the laser spot, and the use of a single collector quadrupole LAICPMS, which precluded the use of a 204Pb-based common Pb correction. However, adding those two features would slow down the workflow and partially defeat the purpose of the high throughput instrument suite. For these reasons, APM+LAICPMS is best thought of as a complementary approach to igneous and metamorphic petrochronology that is particularly useful for reconnaisance studies. In contrast, the step change in sample throughput achieved by APM+LAICPMS is a game changer for sedimentary provenance studies. Allowing 30 minutes for the crude mineral separation routine described in Section 5.1, 30 minutes for preparing a polished grain mount, 2 hours for the APM analysis, 30 minutes for the coordinate conversion and 1 hour for LAICPMS measurements, a streamlined workflow produces paired mineralogical and geochronological datasets at a rate of one sample per 5 hours. Thus, APM+LAICPMS has the potential to bring the fields of petrochronology and sedimentary provenance analysis into the Era of ‘big data’ science (Vermeesch and Garzanti, 2015).
Acknowledgments
We would like to thank FEI for lending the QEMSCAN instrument to us for this developmental research; Mr. Derek Smith for providing and preparing the L’Erée granite sample; David Chew, Brent McInnes and two anonymous reviewers for constructive comments that significantly improved the paper. All the data and computer code required to reproduce the data figures in this paper are provided in the Supplementary Information.
References
Allen, J. L., C. L. Johnson, M. J. Heumann, J. Gooley, and W. Gallin (2012), New technology and methodology for assessing sandstone composition: A preliminary case study using a quantitative electron microscope scanner (QEMScan), Geological Society of America Special Papers, 487, 177–194.
Andò, S., and E. Garzanti (2014), Raman spectroscopy in heavy-mineral studies, Geological Society, London, Special Publications, 386(1), 395–412.
Blatt, H., and R. L. Jones (1975), Proportions of exposed igneous, metamorphic, and sedimentary rocks, Geological Society of America Bulletin, 86(8), 1085–1088.
Chayes, F. (1956a), Petrographic modal analysis: an elementary statistical appraisal, Wiley New York.
Chayes, F. (1956b), The Holmes effect and the lower limit of modal analysis, Min. Mag, 31, 276–281.
Chew, D. M., P. J. Sylvester, and M. N. Tubrett (2011), U–Pb and Th–Pb dating of apatite by LA-ICPMS, Chemical Geology, 280(1), 200–216.
Chopin, C. (1984), Coesite and pure pyrope in high-grade blueschists of the Western Alps: a first record and some consequences, Contributions to Mineralogy and Petrology, 86(2), 107–118.
Compston, W., I. Williams, and C. Meyer (1984), U-Pb geochronology of zircons from lunar breccia 73217 using a sensitive high mass-resolution ion microprobe, Journal of Geophysical Research: Solid Earth, 89(S02).
Dallmeyer, R., R. D’Lemos, and R. Strachan (1992), Timing of post-tectonic Cadomian magmatism on Guernsey, Channel Islands: evidence from 40Ar/39Ar mineral ages, Journal of the Geological Society, 149(1), 139–147.
D’Lemos, R. (1987), The evolution of the Northern Igneous Complex of Guernsey, Channel Islands: some isotopic evidence, Proceedings of the Ussher Society, 6(4), 498–501.
D’Lemos, R., R. Strachan, and C. Topley (1990), The Cadomian orogeny in the North Armorican Massif: a brief review, Geological Society, London, Special Publications, 51(1), 3–12.
Engi, M., P. Lanari, and M. J. Kohn (2017), Significant Ages–An Introduction to Petrochronology, Reviews in Mineralogy and Geochemistry, 83(1), 1–12.
Galehouse, J. S. (1971), Point counting, Procedures in sedimentary petrology, 653, 385–407.
Garzanti, E., S. Andò, and G. Vezzoli (2008), Settling equivalence of detrital minerals and grain-size dependence of sediment composition, Earth and Planetary Science Letters, 273(1), 138–151.
Garzanti, E., S. Andò, G. Vezzoli, M. Lustrino, M. Boni, and P. Vermeesch (2012), Petrology of the Namib Sand Sea: Long-distance transport and compositional variability in the wind-displaced Orange Delta, Earth-Science Reviews, 112(3–4), 173 – 189, doi:10.1016/j.earscirev.2012.02.008.
Garzanti, E., P. Vermeesch, S. Andò, M. Lustrino, M. Padoan, and G. Vezzoli (2014), Ultra-long distance littoral transport of Orange sand and provenance of the Skeleton Coast Erg (Namibia), Marine Geology, 357, 25–36.
Garzanti, E., P. Dinis, P. Vermeesch, S. Andò, A. Hahn, J. Huvi, M. Limonta, M. Padoan, A. Resentini, M. Rittner, and G. Vezzoli (2017), Dynamic uplift, recycling and weathering control on the petrology of subequatorial passive-margin sands (Angola), Journal of Sedimentary Research, doi:10.2110/jsr.2017.65.
Griffin, W., W. Powell, N. Pearson, and S. O’Reilly (2008), GLITTER: data reduction software for laser ablation ICP-MS, Laser Ablation-ICP-MS in the earth sciences. Mineralogical Association of Canada short course series, 40, 204–207.
Hacker, B. R., L. Ratschbacher, L. Webb, and D. Shuwen (1995), What brought them up? Exhumation of the Dabie Shan ultrahigh-pressure rocks, Geology, 23(8), 743–746.
Jackson, S. E., N. J. Pearson, W. L. Griffin, and E. A. Belousova (2004), The application of laser ablation-inductively coupled plasma-mass spectrometry to in situ U–Pb zircon geochronology, Chemical Geology, 211(1-2), 47–69, doi:10.1016/j.chemgeo.2004.06.017.
Jochum, K. P., U. Weis, B. Stoll, D. Kuzmin, Q. Yang, I. Raczek, D. E. Jacob, A. Stracke, K. Birbaum, D. a. Frick, D. Günther, and J. Enzweiler (2011), Determination of Reference Values for NIST SRM 610-617 Glasses Following ISO Guidelines, Geostandards and Geoanalytical Research, 35(4), 397–429, doi:10.1111/j.1751-908X.2011.00120.x.
Katayama, I., S. Maruyama, C. D. Parkinson, K. Terada, and Y. Sano (2001), Ion micro-probe U–Pb zircon geochronology of peak and retrograde stages of ultrahigh-pressure metamorphic rocks from the Kokchetav massif, northern Kazakhstan, Earth and Planetary Science Letters, 188(1), 185–198.
Khosa, J., J. Manuel, and A. Trudu (2003), Results from preliminary investigation of particulate emission during sintering of iron ore, Mineral Processing and Extractive Metallurgy, 112(1), 25–32.
Krauskopf, K. B. (1968), A tale of ten plutons, Geological Society of America Bulletin, 79(1), 1–18.
Kuiper, K. F., A. Deino, F. J. Hilgen, W. Krijgsman, P. R. Renne, and J. R. Wijbrans (2008), Synchronizing Rock Clocks of Earth History, Science, 320, 500–504, doi:10.1126/science.1154339.
Liebske, C. (2015), iSpectra: An Open Source Toolbox For The Analysis of Spectral Images Recorded on Scanning Electron Microscopes, Microscopy and Microanalysis, 21(04), 1006–1016.
Linnemann, U., A. Gerdes, M. Hofmann, and L. Marko (2014), The Cadomian Orogen: Neoproterozoic to Early Cambrian crustal growth and orogenic zoning along the periphery of the West African Craton–Constraints from U–Pb zircon ages and Hf isotopes (Schwarzburg Antiform, Germany), Precambrian Research, 244, 236–278.
Liu, F., and J. Liou (2011), Zircon as the best mineral for P–T–time history of UHP metamorphism: a review on mineral inclusions and U–Pb SHRIMP ages of zircons from the Dabie–Sulu UHP rocks, Journal of Asian Earth Sciences, 40(1), 1–39.
Mattinson, C. G., C. Menold, J.-X. Zhang, and D. Bird (2007), High-and ultrahigh-pressure metamorphism in the North Qaidam and South Altyn Terranes, western China, International Geology Review, 49(11), 969–995.
Mattinson, C. G., J. L. Wooden, J.-X. Zhang, and D. Bird (2009), Paragneiss zircon geochronology and trace element geochemistry, North Qaidam HP/UHP terrane, western China, Journal of Asian Earth Sciences, 35(3), 298–309.
Matzel, J. E., S. A. Bowring, and R. B. Miller (2006), Time scales of pluton construction at differing crustal levels: Examples from the Mount Stuart and Tenpeak intrusions, North Cascades, Washington, Geological Society of America Bulletin, 118(11-12), 1412–1430.
Meeuwis, J., and J. Lutjeharms (1990), Surface thermal characteristics of the Angola-Benguela front, South African Journal of Marine Science, 9(1), 261–279.
Nie, J., W. Peng, K. Pfaff, A. Möller, E. Garzanti, S. Andò, T. Stevens, A. Bird, H. Chang, Y. Song, et al. (2013), Controlling factors on heavy mineral assemblages in Chinese loess and Red Clay, Palaeogeography, Palaeoclimatology, Palaeoecology, 381, 110–118.
O’Sullivan, G., D. Chew, and S. Samson (2016), Detecting magma-poor orogens in the detrital record, Geology, 44(10), 871–874.
Rittner, M., P. Vermeesch, A. Carter, A. Bird, T. Stevens, E. Garzanti, S. Andò, G. Vezzoli, R. Dutt, Z. Xu, and H. Lu (2016), The provenance of Taklamakan desert sand, Earth and Planetary Science Letters, 437, 127 – 137.
Samson, S. D., and R. D’Lemos (1998), U–Pb geochronology and Sm–Nd isotopic composition of Proterozoic gneisses, Channel Islands, UK, Journal of the Geological Society, 155(4), 609–618.
Samson, S. D., and R. D’Lemos (1999), A precise late Neoproterozoic U-Pb zircon age for the syntectonic Perelle quartz diorite, Guernsey, Channel Islands, UK, Journal of the Geological Society, 156(1), 47–54.
Schaltegger, U., C. Fanning, D. Günther, J. Maurin, K. Schulmann, and D. Gebauer (1999), Growth, annealing and recrystallization of zircon and preservation of monazite in high-grade metamorphism: conventional and in-situ U-Pb isotope, cathodoluminescence and microchemical evidence, Contributions to Mineralogy and Petrology, 134(2-3), 186–201.
Schmitz, M. D., and K. F. Kuiper (2013), High-precision geochronology, Elements, 9(1), 25–30.
Simonetti, A., L. M. Heaman, T. Chacko, and N. R. Banerjee (2006), In situ petrographic thin section U–Pb dating of zircon, monazite, and titanite using laser ablation–MC–ICP-MS, International Journal of Mass Spectrometry, 253(1), 87–97.
Sircombe, K. N., and R. A. Stern (2002), An investigation of artificial biasing in detrital zircon U-Pb geochronology due to magnetic separation in sample preparation, Geochimica et Cosmochimica Acta, 66(13), 2379–2397.
Slàma, J., J. Košler, D. J. Condon, J. L. Crowley, A. Gerdes, J. M. Hanchar, M. S. A. Horstwood, G. A. Morris, L. Nasdala, N. Norberg, U. Schaltegger, B. Schoene, M. N. Tubrett, and M. J. Whitehouse (2008), Plešovice zircon – a new natural reference material for U-Pb and Hf isotopic microanalysis, Chemical Geology, 249, 1–35.
Smith, D. C. (1984), Coesite in clinopyroxene in the Caledonides and its implications for geodynamics, Nature, 310(5979), 641–644.
Sobolev, N., and V. Shatsky (1990), Diamond inclusions in garnets from metamorphic rocks: a new environment for diamond formation, Nature, 343(6260), 742–746.
Song, S., J. Yang, Z. Xu, J. Liou, and R. Shi (2003), Metamorphic evolution of the coesite-bearing ultrahigh-pressure terrane in the North Qaidam, Northern Tibet, NW China, Journal of metamorphic Geology, 21(6), 631–644.
Stacey, J. t., and J. Kramers (1975), Approximation of terrestrial lead isotope evolution by a two-stage model, Earth and planetary science letters, 26(2), 207–221.
Sutherland, D., and P. Gottlieb (1991), Application of automated quantitative mineralogy in mineral processing, Minerals Engineering, 4(7-11), 753–762.
Topley, C., M. Brown, R. D’Lemos, G. Power, and R. Roach (1990), The northern igneous complex of Guernsey, Channel Islands, Geological Society, London, Special Publications, 51(1), 245–259.
Vermeesch, P. (2004), How many grains are needed for a provenance study?, Earth and Planetary Science Letters, 224, 441–451.
Vermeesch, P. (2012), On the visualisation of detrital age distributions, Chemical Geology, 312-313, 190–194, doi:10.1016/j.chemgeo.2012.04.021.
Vermeesch, P. (2013), Multi-sample comparison of detrital age distributions, Chemical Geology, 341, 140–146.
Vermeesch, P., and E. Garzanti (2015), Making geological sense of ‘Big Data’ in sedimentary provenance analysis, Chemical Geology, 409, 20–27.
Vermeesch, P., C. R. Fenton, F. Kober, G. F. S. Wiggs, C. S. Bristow, and S. Xu (2010), Sand residence times of one million years in the Namib Sand Sea from cosmogenic nuclides, Nature Geoscience, 3, 862–865, doi:10.1038/ngeo985.
Vermeesch, P., A. Resentini, and E. Garzanti (2016), An R package for statistical provenance analysis, Sedimentary Geology.