4206 and
  4326
4326
The expected equivalent widths of Mn II  4206 and
  4326
were calculated for each star, based on the mean Mn abundance derived from
the other visible-region Mn II lines. For this calculation, we have made
the usual assumption that the lines have only one component. The measured
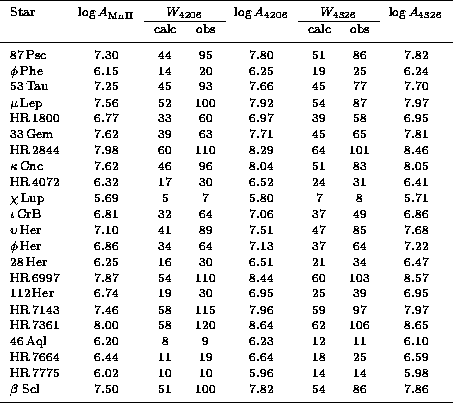
equivalent widths are compared to the calculated values in
Table 4 (dilution effects in the binaries have been
taken into account by scaling up the observed values).
Fig. 3 demonstrates the discrepancy between the predicted
strengths of both lines and their observed strengths, which tends to get
worse at high abundances; stars with low abundances do not show this
disagreement. From Fig. 4, it is clear that this
discrepancy is more directly related to the strength of the lines than to
the total atmospheric abundance of Mn.
4326
were calculated for each star, based on the mean Mn abundance derived from
the other visible-region Mn II lines. For this calculation, we have made
the usual assumption that the lines have only one component. The measured
equivalent widths are compared to the calculated values in
Table 4 (dilution effects in the binaries have been
taken into account by scaling up the observed values).
Fig. 3 demonstrates the discrepancy between the predicted
strengths of both lines and their observed strengths, which tends to get
worse at high abundances; stars with low abundances do not show this
disagreement. From Fig. 4, it is clear that this
discrepancy is more directly related to the strength of the lines than to
the total atmospheric abundance of Mn.
Table 4: Mn II  4206 and 4326. The calculated values of
 are based on the assumption of single component line
structures and are clearly too weak in stars with high Mn abundances. The
individual line abundances are based on the adopted
hfs multicomponent models in Table 5.
are based on the assumption of single component line
structures and are clearly too weak in stars with high Mn abundances. The
individual line abundances are based on the adopted
hfs multicomponent models in Table 5.
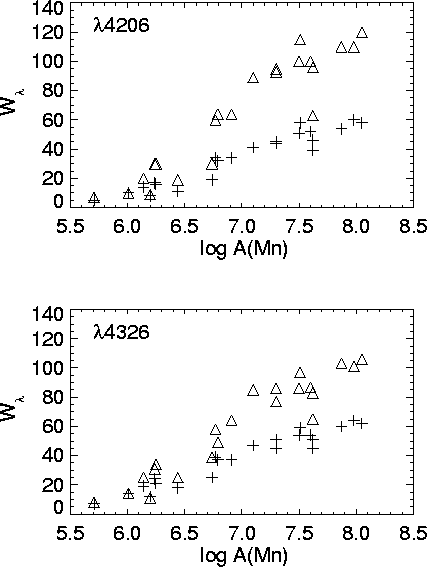
Figure 3: Mn II discrepancy in  4206 and
  4326: calculated
and observed
equivalent widths are denoted by crosses and triangles respectively.
4326: calculated
and observed
equivalent widths are denoted by crosses and triangles respectively.
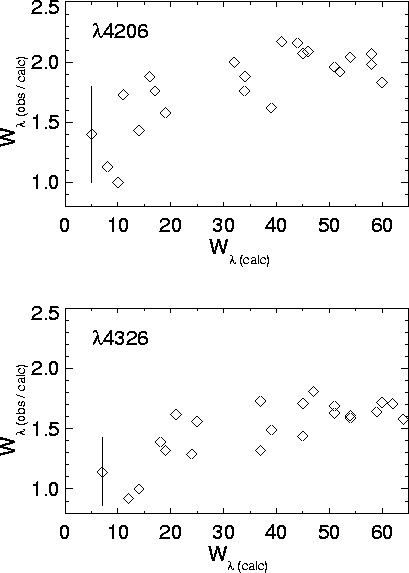
Figure 4: Mn II discrepancy in  4206 and
  4326: ratio
(obs/calc) versus equivalent width. The calculated values represent
single-component line models. The points for the weakest Mn star have
considerable uncertainty and are shown with appropriate large error bars.
4326: ratio
(obs/calc) versus equivalent width. The calculated values represent
single-component line models. The points for the weakest Mn star have
considerable uncertainty and are shown with appropriate large error bars.
Attempts to account for these anomalies by adjustments in atomic line
parameters ( ,
,  ,
,  ) or in stellar parameters
(
) or in stellar parameters
( ) proved unfruitful. Further investigation revealed that the
 4206 and
  4326 features in the narrow-line star HR7775
(Figs. 5 and 6) were visibly broader than
the other lines of Mn II . (Note that, for the work presented here, we
did
not make a detailed search for other Mn II lines with visible broadening
or curve-of-growth anomalies, either of which could indicate strong hfs
effects. A further search for lines which may show similar effects is the
subject of future investigations.)
4326 features in the narrow-line star HR7775
(Figs. 5 and 6) were visibly broader than
the other lines of Mn II . (Note that, for the work presented here, we
did
not make a detailed search for other Mn II lines with visible broadening
or curve-of-growth anomalies, either of which could indicate strong hfs
effects. A further search for lines which may show similar effects is the
subject of future investigations.)
The most obvious candidate for a physical cause is hyperfine structure (hfs). We were unable to find any literature describing measured or theoretical hfs in these lines, but the behaviour observed in Figs 3, 4, 5, 6, 7 and 8 appears consistent with the hypothesis that their profiles are significantly affected by hfs: in weak-lined stars where the combined feature is too weak to be saturated, the hfs will effectively spread the lines out; in strong-lined stars where the feature is saturated, the action of the hfs will be to desaturate the lines, making them stronger.
This hypothesis was tested by constructing several simplified hfs models for these lines.
For  4206, each model contained a number of equal-strength
components, spread over a wavelength range
4206, each model contained a number of equal-strength
components, spread over a wavelength range  . The only
constraint on
. The only
constraint on  was that the synthesized lines should be
consistent with the width of the weak observed lines in HR 7775. We
tested two- and three-component models (the total gf divided equally
amongst the components) with the components spread over equal intervals.
We found that splitting the line into three components (with
was that the synthesized lines should be
consistent with the width of the weak observed lines in HR 7775. We
tested two- and three-component models (the total gf divided equally
amongst the components) with the components spread over equal intervals.
We found that splitting the line into three components (with
 = 0.086Å; see Table 5) allows
the synthetic profile to fit well, at an abundance consistent with the
other lines of Mn, for nearly all stars. Example plots of the way in
which introducing hfs makes a fit to the
= 0.086Å; see Table 5) allows
the synthetic profile to fit well, at an abundance consistent with the
other lines of Mn, for nearly all stars. Example plots of the way in
which introducing hfs makes a fit to the  4206 line possible is
shown for HR 7775 (Fig. 5) and HR 7361
(Fig. 7). The two-component model (
4206 line possible is
shown for HR 7775 (Fig. 5) and HR 7361
(Fig. 7). The two-component model ( =
0.070Å) did not provide enough desaturation for the very strong-lined
stars, nor did it fit HR 7775 at the line centre; we attribute lack of
perfect agreement to the simplified symmetric structure adopted (normally
hfs produces `flag' patterns, with a mixture of strong and weak
components). Increasing the number of components beyond three had little
further effect; once there is enough hfs to make the components
individually unsaturated (separated from one another by
=
0.070Å) did not provide enough desaturation for the very strong-lined
stars, nor did it fit HR 7775 at the line centre; we attribute lack of
perfect agreement to the simplified symmetric structure adopted (normally
hfs produces `flag' patterns, with a mixture of strong and weak
components). Increasing the number of components beyond three had little
further effect; once there is enough hfs to make the components
individually unsaturated (separated from one another by  1 thermal
line width) adding in extra components broadens the line wings but does
not deepen it significantly. The actual pattern should have 15 components
(
1 thermal
line width) adding in extra components broadens the line wings but does
not deepen it significantly. The actual pattern should have 15 components
( ,
,  ,
,  ), so it is obvious that our model
is only a crude approximation.
), so it is obvious that our model
is only a crude approximation.
The  4326 line is visibly asymmetric in HR7775 and the other
stars with low
4326 line is visibly asymmetric in HR7775 and the other
stars with low  . After several trials, we adopted the simplified
structure shown in Table 5 and Figs. 6
and 8 as a compromise, in order to avoid an overly
complicated multiple-component model, while fitting reasonably well the
asymmetric profiles in all the sharp-lined stars studied. Again, the
actual (but unknown) hfs is undoubtedly very much more complicated, with
16 components (
. After several trials, we adopted the simplified
structure shown in Table 5 and Figs. 6
and 8 as a compromise, in order to avoid an overly
complicated multiple-component model, while fitting reasonably well the
asymmetric profiles in all the sharp-lined stars studied. Again, the
actual (but unknown) hfs is undoubtedly very much more complicated, with
16 components ( ,
,  ), some of which would be very
weak. The approximation derived here permits reasonable-looking synthesis
fits to all the stars in the sample.
), some of which would be very
weak. The approximation derived here permits reasonable-looking synthesis
fits to all the stars in the sample.
Storey [1998] has made available preliminary calculations of the
detailed hyperfine structure of  4206 of MnII especially for the
present investigation. The uncertainties in the 15-component structure
obtained are considerable and further work is needed. However, if we
allow the derived pattern to have the largest width still consistent with
our spectra of HR 7775 and HR 7361, the abundances derived (see
Table 4) in the stars with the strongest lines would be
reduced by a further 0.2 dex.
4206 of MnII especially for the
present investigation. The uncertainties in the 15-component structure
obtained are considerable and further work is needed. However, if we
allow the derived pattern to have the largest width still consistent with
our spectra of HR 7775 and HR 7361, the abundances derived (see
Table 4) in the stars with the strongest lines would be
reduced by a further 0.2 dex.
Without the hfs hypothesis, we can fit the  4206 and
 4326 equivalent widths (in stars with strong Mn) only with an
extremely high abundance (2-3 dex greater than that from the other lines
of MnII ), and these synthetic profiles do not fit, as the line wings
become too wide and the cores too shallow. Therefore, the hfs hypothesis
solves the profile problem for both lines but does not completely
eliminate the abundance discrepancy.
4326 equivalent widths (in stars with strong Mn) only with an
extremely high abundance (2-3 dex greater than that from the other lines
of MnII ), and these synthetic profiles do not fit, as the line wings
become too wide and the cores too shallow. Therefore, the hfs hypothesis
solves the profile problem for both lines but does not completely
eliminate the abundance discrepancy.
Table 5: Model hfs structures used for  4206 and
  4326
4326
The mean Mn II abundance (taken from the data in Table 2)
is compared with the three-component results for  4206 in
Table 4 and Fig. 9, and with the
four-component results for
4206 in
Table 4 and Fig. 9, and with the
four-component results for  4326 in the same table and figure. As
noted above, the trends in Fig. 9 show clearly that the
simplified hfs models adopted here go a long way towards explaining the
unexpected strengths of these lines, but do not entirely eliminate a
discrepancy in derived abundance. The single exception to these trends is
33 Gem, which is treated in this work as a single star, but was suspected
of being a double-lined spectroscopic binary by Hubrig & Launhardt
[1993]. As previously noted, the question of binarity is not
yet resolved, although our spectra did have the same `square' profiles
observed by Hubrig & Launhardt.
4326 in the same table and figure. As
noted above, the trends in Fig. 9 show clearly that the
simplified hfs models adopted here go a long way towards explaining the
unexpected strengths of these lines, but do not entirely eliminate a
discrepancy in derived abundance. The single exception to these trends is
33 Gem, which is treated in this work as a single star, but was suspected
of being a double-lined spectroscopic binary by Hubrig & Launhardt
[1993]. As previously noted, the question of binarity is not
yet resolved, although our spectra did have the same `square' profiles
observed by Hubrig & Launhardt.
Given the expectation that the hfs of these two lines should be very complicated, we believe that at least some of the residual trends of their abundance discrepancies vs. mean abundance from other lines may be due to the numerous weak hfs components. Our preliminary model using Storey's predictions does not predict complete elimination of the residual discrepancies although the effect is in the right direction. A laboratory study of the hfs in Mn II is urgently required to resolve these problems.
We also conducted an experiment to test the effect of systematic errors in
microturbulence (see also the error discussion in Errors ): the
results demonstrated that postulating substantially larger (1 kms )
microturbulence in HR 7361, a star with very strong Mn II and a
relatively low
)
microturbulence in HR 7361, a star with very strong Mn II and a
relatively low  , has only a small (-0.1 dex) effect on the derived
abundance.
, has only a small (-0.1 dex) effect on the derived
abundance.
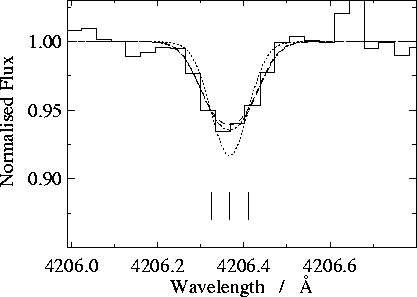
Figure 5: The Mn II  4206 line in HR 7775 (histogram). A
single line fit (dotted line) with the observed
4206 line in HR 7775 (histogram). A
single line fit (dotted line) with the observed  does not match
well. Using a 2-component
(dashed line) or 3-component (dot-dash line) hfs model
(Table 5) provides increasingly better fits. Positions
and relative strengths of components are shown by the marks below the
line.
does not match
well. Using a 2-component
(dashed line) or 3-component (dot-dash line) hfs model
(Table 5) provides increasingly better fits. Positions
and relative strengths of components are shown by the marks below the
line.
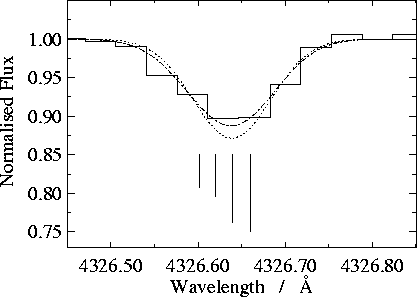
Figure 6: The Mn II  4326 line in HR 7775 (histogram). A
single line fit (dotted line) for the observed
4326 line in HR 7775 (histogram). A
single line fit (dotted line) for the observed  does not match
well. Using a 4-component
(dot-dash line) hfs model (see Table 5) provides a
better fit. Positions and relative strengths of components are shown by
marks below the line.
does not match
well. Using a 4-component
(dot-dash line) hfs model (see Table 5) provides a
better fit. Positions and relative strengths of components are shown by
marks below the line.
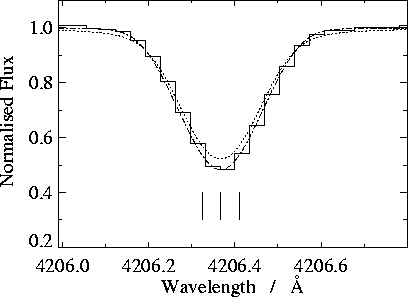
Figure 7: The Mn II  4206 line in HR 7361 (histogram). A
single line fit (dotted line) to the observed
4206 line in HR 7361 (histogram). A
single line fit (dotted line) to the observed  does not
match well. Using the same hfs model as in Fig.
5 (dot-dash line) produces an improved fit.
does not
match well. Using the same hfs model as in Fig.
5 (dot-dash line) produces an improved fit.
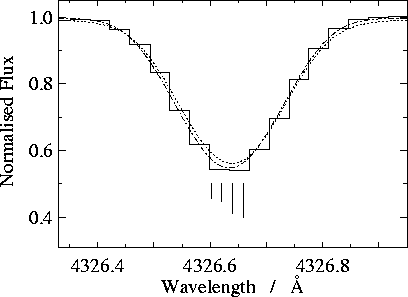
Figure 8: The Mn II  4326 line in HR 7361 (histogram). A
single line fit (dotted line) does not
match well. Using the same hfs model as in Fig. 6
(dot-dash
line) produces an improved fit.
4326 line in HR 7361 (histogram). A
single line fit (dotted line) does not
match well. Using the same hfs model as in Fig. 6
(dot-dash
line) produces an improved fit.
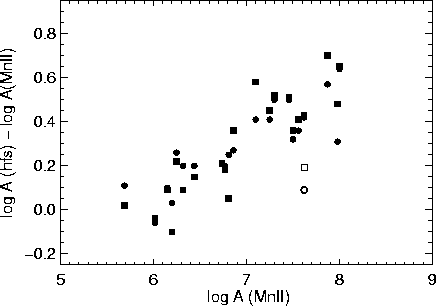
Figure 9: The residual abundance excess from the simplified model hfs vs.
mean Mn II abundance from the other visible-region lines. Filled
squares,
 4206; filled circles,
  4326. Open symbols, 33Gem
(see text).
4326. Open symbols, 33Gem
(see text).