Data Processing (with Mosflm)
N.B. This page is rapidly becoming obsolete. For the latest in data processing try using imosflm
Once you have collected a dataset the images need to be converted into a list of reflections indexed by h,k,l with their related intensities (I) and the error of intensity (SIGI). The first step is to use a program such as Mosflm to convert the data from spots on an image to a list of indexed reflections.
The following instructions overlap a bit with the "strategy" page however I have added many more hints and tips!
First you need to open a Unix/Linux shell preferably in the directory where you are saving your images and type:
setccp4
mosflm
You then need to tell Mosflm which image to look at by typing in your image name (something along the lines of):
image ./name_1_001.img
go
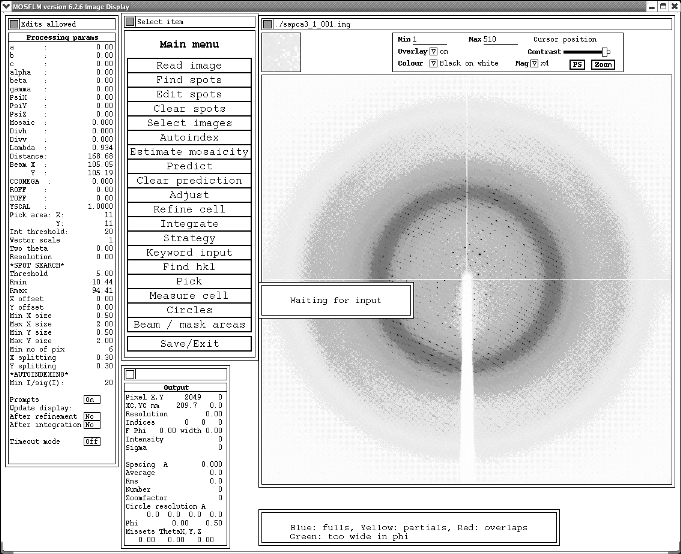
This should give you a window that looks like:
Next you need to do pick spots for the Autoindex routine. Do this by clicking on "Find Spots" and then following the defaults. Sometimes an error message will pop up complaining that it has found too many spots and wants to "increase the threshold". This is perfectly reasonable so just click "OK". You should see a bunch of red crosses appearing on your diffraction image once it is finished.
It is normally best to pick spots across your dataset for more accurate autoindexing, so next you need to read in another image (e.g. 90 degrees away from your starting image). To do this click on "Read image" and then type 90. The program should pick up the image name and the phi angle automatically. You then need to pick spots as before, and again follow the defaults until red crosses appear on your second image. You can repeat this process again for a third image, this time 180 degrees away from your starting image. Mosflm automatically saves all the spots from the previous images each time you load a new image.
Once you have your spots picked, you can click on the "Autoindex" button. For the vast majority of data you will want to again accept all the defaults by hitting enter each time it asks you a question. Occasionally, if your unit cell is very large, you can give it a large "maximum cell edge". I would recommend putting in 400 if you think the default of 181 is too small. If you keep hitting enter you will eventually end up with something that look like this:
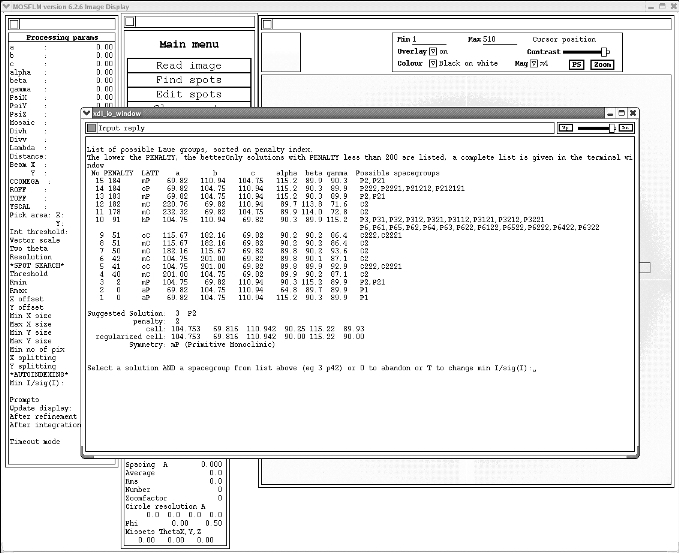
Actually choosing the correct spacegroup can depend on a lot of factors, however for a simple case as illustrated above, you want to choose the spacegroup with the highest symmetry but lowest penalty. In this case it would be the monoclinic P2 (NB it gives you a suggested solution). To select the spacegroup you type:
3 p2
Again you should hit enter to accept all the defaults. You will end up back on the screen with all the red crosses on your image. Next you want to check the accuracy of the prediction. To do this click "Clear Spots" and enter "Y". Then click the "Predict" button. This will hopefully produce a lot of blue and yellow boxes around many of your spots. Check to make sure the boxes are actually around your spots by zooming in to different sections of your image (click "Zoom" on the top right of the screen, and then draw a box using the left mouse button around the segment you want to see more clearly). Not all the spots will be boxed due to overlaps etc., but you want to make sure a good number of them are. To cancel the zoom and return back to the image double click on the zoom button.
AUTOINDEXING PROBLEMS
These are quite common. Essentially it means that Mosflm is having problems measuring your unit cell and predicting a spacegroup. In the above example the monoclinic primitive spacegroup is a clear choice because of the 38 point penalty gap between it and the next option - monoclinic centred (C2). However, quite often the correct choice is not as obvious. Some tips for resolving your spacegroup:
Setting Resolution and Mosaicity
As the program is currently trying to box spots right out to the edge of the detector, you next need to limit the resolution. To do this click on the "Pick" button and then draw a box in an area where there are few spots. This should give you something that look like:
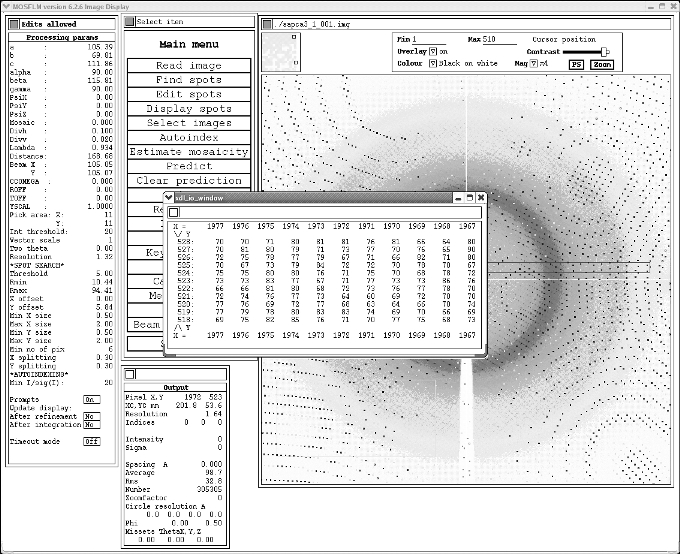
Note sometimes the pop-up window appears right at the bottom of the screen.
In the pop-up look to see the average pixel value (in the above case I am guessing about 72). This should be approximately your background value for the image. Enter this value into the "Min" box at the top right of the screen and press enter. The background of the image should get much lighter allowing you to see the spots more clearly. WHATEVER YOU DO DO NOT PRESS THE X IN THE TOP RIGHT OF THE POP-UP as this will kill the whole program. To get rid of the pop-up move it out of the way and then click on the "cancel pick" button.
You can now estimate your highest resolution more clearly by zooming into an area on the detector where the spots look to be fading outing, and clicking on the last couple spots you can see. The resolution at this point will appear in the "output" box (middle bottom of screen). Next click on the word "Resolution" in the "input box" (left of screen, almost exactly in the middle) and enter your maximum resolution. After pressing enter you should see your prediction boxes only extending to this higher resolution.
To estimate mosaicity click on "Estimate Mosaicity". This will tell you that it is "waiting" and then give you a value. Accept this value. On occasion the program complains that it cannot estimate a mosaicity value. You can therefore set one yourself by clicking on the word "Mosaic" in the input box (left of screen, approximately a quarter of the way down) and input the number 0.5. You should see more prediction boxes (probably yellow) appear. Have a look to see if the boxes are around more of the spots. If not increase the mosaicity. I wouldn't recommend a mosaicity value much higher than 1.
Refine Cell
You should now hopefully have a reasonable prediction that finds at least some of your spots. To refine the cell further you next need to click on the "Refine Cell" button. This will compare predictions across images you define, and try to find the "best" cell that fits the whole dataset. I normally go for three sets of three images spanning the whole dataset. You should type in something along the lines of:
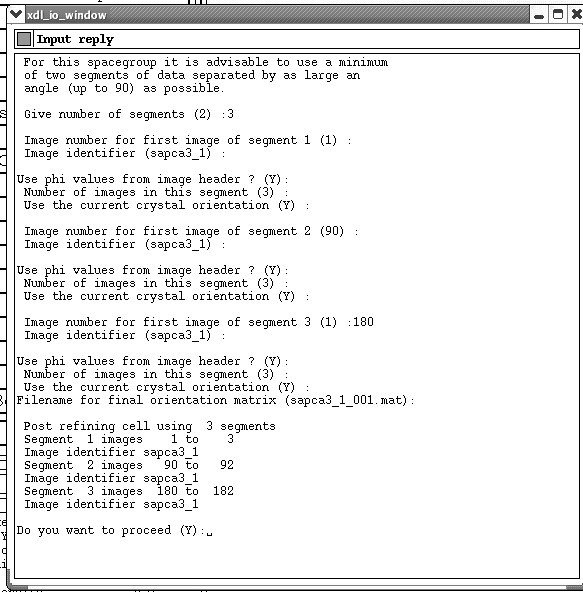
Hit yes to proceed. This should now automatically refine the cell over your specified images. When it is finished a pop-up will ask you if you want to "Reset miss-sets to first image". Input "Y".
Sometimes the refine cell routine falls over with a variety of complaints. This is pretty much always related to problems with autoindexing. In severe cases the program will crash and you will lose everything done so far. It's a pain but it tells you something is going wrong!!
Integrate
If you have got this far - well done! You are now ready to convert all the spots into a list of measured reflections, and there are two ways to do this:
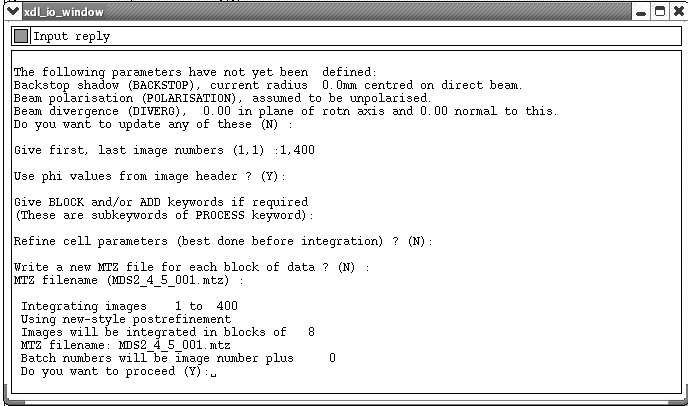
Integrating method 1: Using the GUI just click on the "Integrate" button. Accept the defaults, define which images you want to integrate (in the following example I am integrating images 1 to 400, so type "1,400") and then finally hit enter to run the job. The window will look like this:
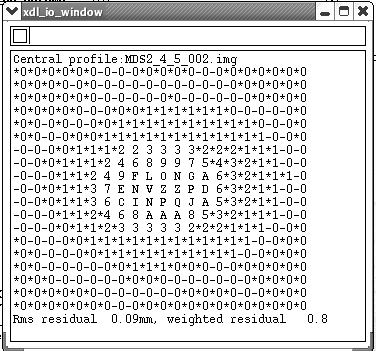
As the job is running you will want to look at the little pop-up boxes and make sure your RMS residual is below 0.15 (a measure of how close your spots are to the "ideal" spot profile):
Depending on the computer speed this process could take up to a couple hours. If something goes wrong it normally tells you what this is, and gives a suggestion for fixing the problem. Quite often it might suggest typing in key-words. If you need to do this, click on the "Keyword Input" button, type in the required command and then type end.
If the job runs successfully the screen will return back to normal at the end with a little box saying "waiting for input".
Integrating method 2: If you have been having problems processing the data, and need to input a number of different keywords, it is much easier to run Mosflm using a script file. To do this you will have to click "Save/Exit" AND MAKE SURE A .sav FILE IS WRITTEN OUT. To be sure type "save" at the Mosflm prompt before exiting the program completely (by typing end). The .sav file contains all the information needed to integrate the data.
Next you need to open an "nedit" session (type nedit at the shell prompt) and paste in the following program:
#!/bin/tcsh
mosflm <<eof-mos >! mos.log
TITLE my protein collected at Grenoble, september 2006
WAVELENGTH 0.934
DIVE 0.001 0.001 ! DIVH DIVV
DISPER 0.00020 ! DISP Correlated Delta(Lambda)/Lambda
SYNCHROTRON DELCOR 0.0001
DETECTOR ADSC
BEAM 105.03 104.90
GAIN 0.41
ADCOFFSET 0
DISTANCE 143.145
DISTORTION YSCALE 1.0015 TILT 12 TWIST 9
MATRIX MDS_6_1_001.mat
!This matrix was obtained from autoindexing
! The following images were used: 1 180
SYMMETRY 18
MOSAIC 0.6
TEMPLATE MDS_6_1_###.img
DIRECTORY ./data/
RASTER 23 17 12 6 4
SEPARATION 1.12 0.92 CLOSE
OVERLOAD CUTOFF 65500
RESOLUTION 1.6
REFINE RESID 20
PROCESS 001 TO 263 START 0 ANGLE 0.35 BLOCK 10
HKLOUT mosflm.mtz
RUN
eof-mos
Then in the nedit window select File-> Open and select the .sav file made by Mosflm. You need to copy all the parameters from your sav file into the above program. I suggest doing this line by line, cutting one line at a time out of my program and replacing it with the equivalent line from your sav file. I would also suggest changing the title line so that it refers to your protein, and also setting the GAIN line to 0.4 (which always works better than the 0.25 suggested in the sav file). You also need to set your own highest resolution with the RESOLUTION command, and set your images and phi angle (ANGLE) on the PROCESS line. Any extra commands suggested by previous mosflm runs can be inserted after the RESOLUTION command. You also might want to look at the Mosflm manual (http://www.mrc-lmb.cam.ac.uk/harry/mosflm/mosflm_user_guide.html) for further tips, tweaks and keywords.
Finally save your new file as "mosflm.inp" and exit nedit. Then at the shell prompt type:
chmod +x mosflm.inp
to ensure your program is executable. You should then simply be able to type:
mosflm.inp
at the shell prompt to run the program. If it complains try typing:
setccp4
mosflm.inp
Checking your integration
Once your integration has finished (using either method) you need to check your SUMMARY file that should be written out in your working directory. If you are still using the GUI it is probably best to open another shell prompt, navigate to the working directory and type:
nedit SUMMARY
Maximise the screen (as the file has a lot of columns) and scroll down through the results (which are in groups of 20) until you get to the table that lists all the images just below the error messages:
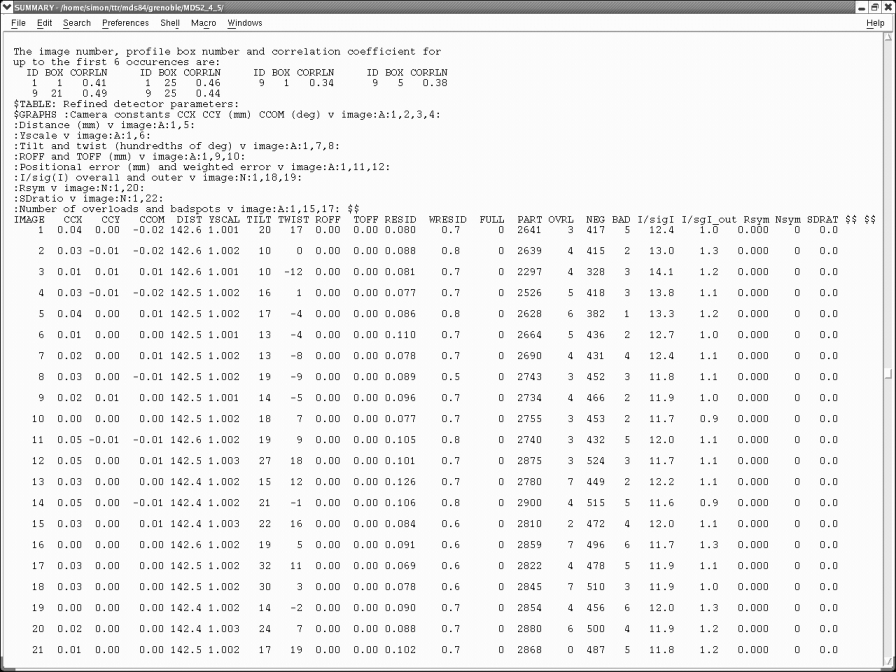
Scroll down this list making sure your "RESID" is below 0.15, your "WRESID" is close to 1.0 and your "I/sgI_out" is around 2ish. In the above example the I/sgI_out is quite low so I would need to consider re-integrating to a slightly lower resolution (1.8A instead of 1.6A in this case). You can generally ignore any error messages in the file if your RESID's and I/sgI_out look good. If your data is not so good you might need to enter extra instructions in your integrate step as suggested by the error messages (immediately above this table). This can either be done through the "Keyword Input" button in the GUI, or directly in the mosflm.inp file. It is also worth checking to see if your images are consistent. Occasionally you get one or two bad images that can throw the integration off, or sometimes the crystal dies during the course of the experiment and thus later images are significantly worse than earlier images. To solve these problems you can change which images you include in the integration step.
Once you are happy with your integration results you are ready to scale your data. The key file you will need to carry on into later programs is called mosflm.mtz