


Zebrafish research at UCL
Zebrafish research at UCL
About zebrafish research at ucl
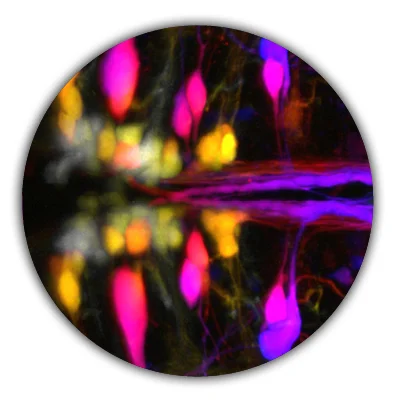
The zebrafish is a small tropical fish that has become one of the favoured animal model systems for research in many areas including embryonic development, genetic analyses of disease, neural circuit function and behaviour. One reason for this popularity is that zebrafish embryos are optically transparent and genetically tractable making them ideally suited for studies of cell and tissue behaviour and function. Zebrafish also exhibit sleep, social, hunting and other complex behaviours and progress in understanding the neuroanatomy of the brain is facilitating studies of the neural circuits mediating these behaviours.
On this site, you can learn about the wide range of research projects at UCL that use zebrafish and see many beautiful images and movies from these projects. We appreciate that not all our visitors are trained scientists and so we have public outreach pages that help to explain what we do.
Research groups


There are many research groups using zebrafish for research at UCL and you can find out about individual labs by clicking the buttons abaove, or continue reading about Zebrafish at UCL.
News
News
Latest news


Wilson/Rihel/Bianco/Tada Lab Work Experience 2024
October halfterm: 28th October-1st November 10:00-16:00
**Applications now open**
For more information about the programme and how to apply click button below.
Images
Images
Images


Many of our images are available for download from Wellcome Images.
Simply search the collection for 'Zebrafish'. All images and movies are copyright of UCL Zebrafish Group please request permission before using.
Outreach
Outreach
Wilson/Rihel/Bianco/Tada Lab Work Experience 2024
October halfterm: 28th October-1st November 10:00-16:00
**Applications now open**
For more information about the programme and how to apply click the Zebrafish Academy button below.
In the fish labs we love doing experiments, but we also love sharing our enthusiasm for science and for zebrafish with others. That is why we take our outreach activities very seriously.
We are committed to promoting science, critical thinking and education of young people via our Outreach Activities. Our aim is to reach students from all backgrounds, help them to engage with STEM and to gain an insight into the opportunities available in higher education and STEM research.
Our activities
We offer a range of outreach activities, both ‘in classroom’ workshops, as well as ‘on-campus’ at UCL. Please choose an option below to explore our outreach programs. Please note that only teachers may request school visits from zebrafish researchers(LAB2SCHOOL) and visits to the zebrafish lab for school students(SCHOOL2LAB).

The Zebrafish Academy:
A-level Work Experience Program

Request a visit
to our Lab

Request a visit
to your School
NB: As we are a research lab, we can only offer the outreach activities mentioned above to a limited number of students and school groups. We hope, that we can expand our programme in the future to offer these opportunities to more and more students!
outreach blog
Read about what the Zebrafish Lab have been doing to spread our love of science.


Resources
Resources
resources


Zebrafish Green Lab
Zebrafish Green Lab
ZebrafishUCL are focussing on 3 key areas to make our research more sustainable. Please follow the links below to read more about how we are reducing single-use plastics, energy consumption and other cultural changes to improve sustainability in our lab.

PLASTIC

ENERGY
CULTURE OF CHANGE
Publications
Publications
Publications
For a full list of Zebrafish UCL publications by year click here, or choose a year below. You can also visit our publication summaries page to find summaries of papers that need less scientific knowledge to understand.
Recent publications
Benoit E, Lyons DG, and Rihel J (2023).
Noradrenergic Tone is Not Required for Neuronal Activity-Induced Rebound Sleep in Zebrafish.
J Comp Physiol B. 2023 Jul 22. doi: 10.1007/s00360-023-01504-6.
Ali, M.A., Lischka, K., Preuss, S.J., Trivedi, C.A., Bollmann, J.H. (2023)
A synaptic corollary discharge signal suppresses midbrain visual processing during saccade-like locomotion.
Nature communications. 14:75927592.
Chong-Morrison V, Mayes S, Simões FC, Senanayake U, Carroll DS, Riley PR, Wilson SW, Sauka-Spengler T.
Ac/Ds transposition for CRISPR/dCas9-SID4x epigenome modulation in zebrafish.
Biol Open. 12(6):bio059995. doi: 10.1242/bio.059995.
Zylbertal A & Bianco IH (2023)
Recurrent network interactions explain tectal response variability and experience-dependent behavior
eLife 12:e78381. https://doi.org/10.7554/eLife.78381
María Hernández-Bejarano, Gaia Gestri, Clinton Monfries, Lisa Tucker, Elena I. Dragomir, Isaac H. Bianco, Paola Bovolenta, Stephen W. Wilson, Florencia Cavodeassi (2022)
Foxd1-dependent induction of a temporal retinal character is required for visual function.
Development 149 (24) doi: https://doi.org/10.1242/dev.200938
Jason J Otterstrom, Alexandra Lubin, Elspeth M Payne, Yael Paran (2022)
Technologies bringing young Zebrafish from a niche field to the limelight.
SLAS Technol. 2022 Apr;27(2):109-120. doi: 10.1016/j.slast.2021.12.005
Tuschl K, White RJ, Trivedi C, Valdivia LE, Niklaus S, Bianco IH, Dadswell C, González-Méndez R, Sealy IM, Neuhauss SCF, Houart C, Rihel J, Wilson SW, Busch-Nentwich EM.(2022)
Loss of slc39a14 causes simultaneous manganese hypersensitivity and deficiency in zebrafish.
Dis Model Mech. 15(6).doi: 10.1242/dmm.044594.
Turner KJ, Hawkins TA, Henriques PM, Valdivia LE, Bianco IH, Wilson SW and Folgueira M (2022)
A Structural Atlas of the Developing Zebrafish Telencephalon Based on Spatially-Restricted Transgene Expression.
Front. Neuroanat. 16:840924. doi: 10.3389/fnana.2022.840924
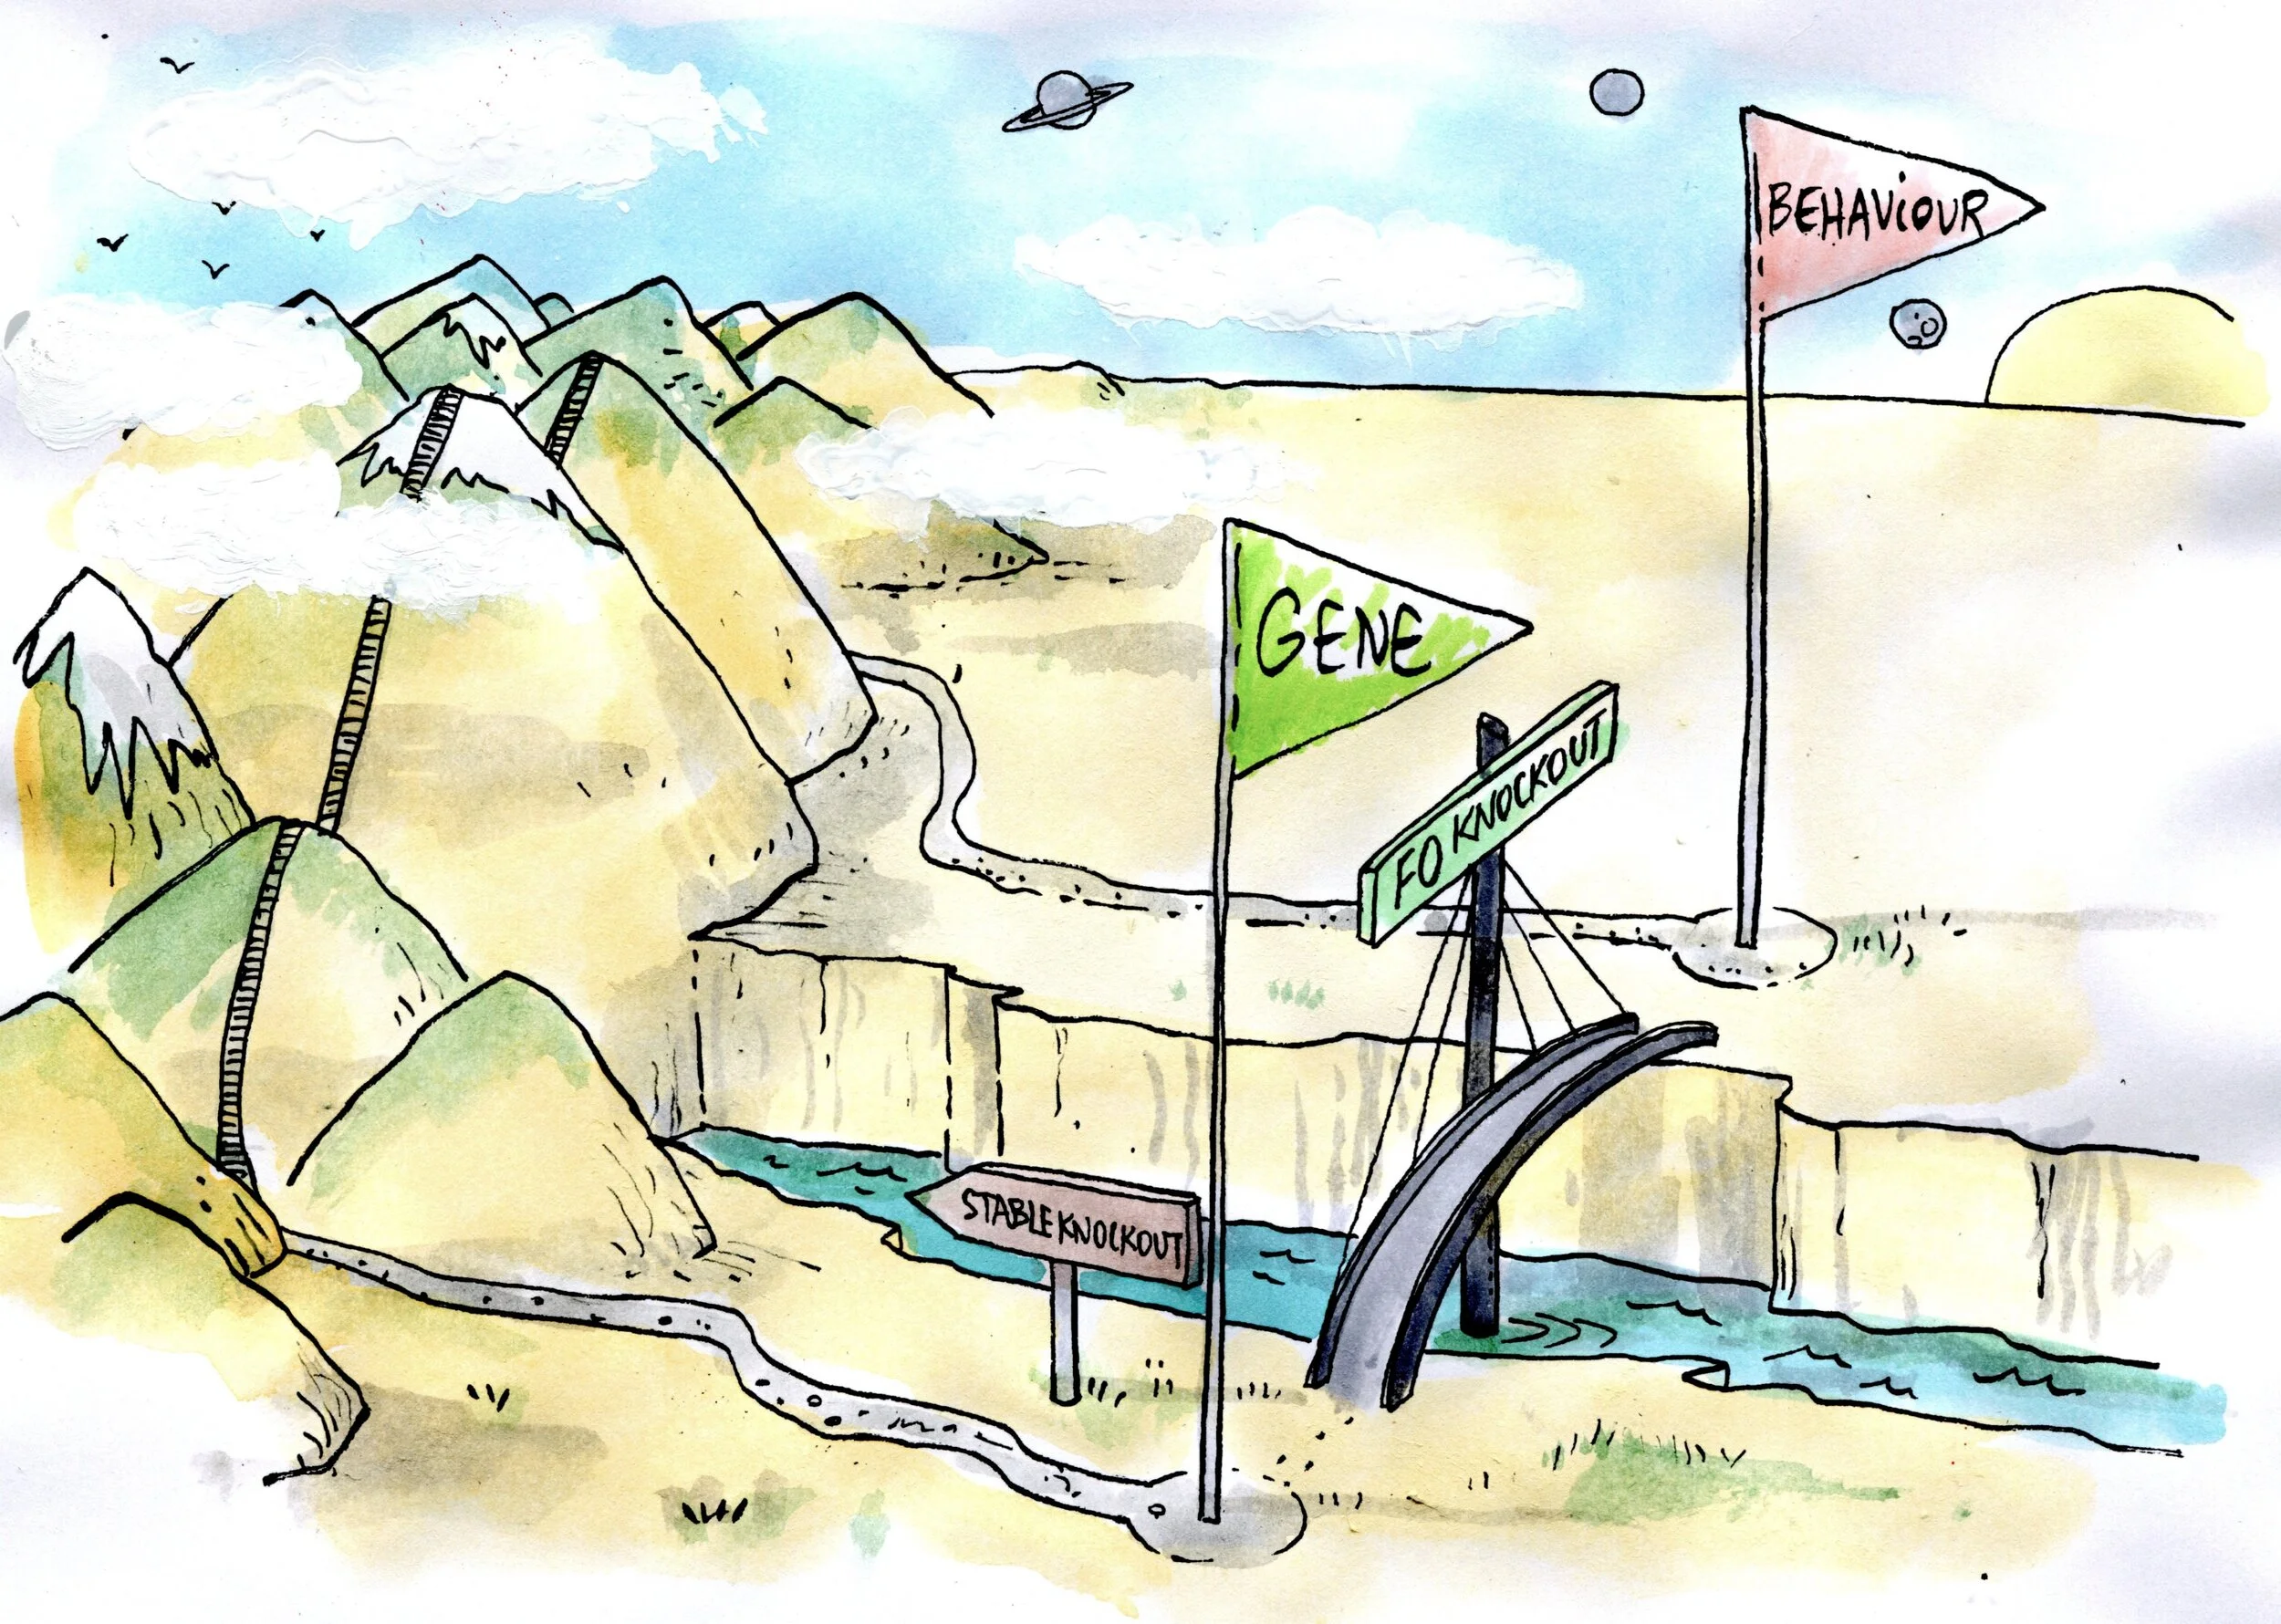
Kroll F, Powell GT, Ghosh M, Antinucci P, Hearn TJ, Tunbak H, Lim S, Dennis HW, Fernandez JM, Hoffman EJ, Whitmore D, Dreosti E, Wilson SW and Rihel J (2021).
A simple and effective F0 knockout method for rapid screening of behaviour and other complex phenotypes.
Elife: e59683.
Oscar A. Peña, Alexandra Lubin, Jasmine Rowell, Yvette Hoade, Noreen Khokhar, Hanna Lemmik, Christopher Mahony, Phoebe Dace, Chianna Umamahesan and Elspeth M. Payne (2021).
Differential Requirement of Gata2a and Gata2b for Primitive and Definitive Myeloid Development in Zebrafish
Front. Cell Dev. Biol; doi.: 10.3389/fcell.2021.708113
Alexandra Lubin , Jason Otterstrom, Yvette Hoade, Ivana Bjedov , Eleanor Stead, Matthew Whelan , Gaia Gestri, Yael Paran, Elspeth Payne (2021).
A versatile, automated and high-throughput drug screening platform for zebrafish embryos
Biol Open 2021 Sep 15;10(9):bio058513. doi: 10.1242/bio.058513.
Barlow IL, Mackay E, Wheater E, Goel A, Lim S, Zimmerman S, Woods I, Prober DA, Rihel J (preprint).
A genetic screen identifies dreammist as a regulator of sleep.
bioRxiv 2020.11.18.388736; doi: https://doi.org/10.1101/2020.11.18.388736
Moore RE, Clarke J, Alexandre P.
Protrusion-Mediated Signaling Regulates Patterning of the Developing Nervous System.
Front Cell Dev Biol. 2020 Sep 29;8:579073. doi: 10.3389/fcell.2020.579073.
Rihel J (2020).
Sleep Across the Animal Kingdom. in Sleep Science
Oxford University Press, pages 15-31
Ozcan GG, Lim S, Leighton PLA, Allison WT, Rihel J (2020).
Sleep is bi-directionally modified by amyloid beta oligomers.
Elife Jul 14;9:e53995. doi: 10.7554/eLife.53995
Haas AJ, Zhini C, Ruppel A, Hartmann C, Ebnet K, Tada M, Balda M, Matter K (2020)
Interplay between extracellular matrix stiffness and JAM-A regulates mechanical load on ZO-1 and tight junction assembly.
Cell Reports 32, 107924.
Takeuchi Y, Narumi R, Akiyama R, Vitiello E, Shirai T, Tanimura N, Kuromiya K, Ishikawa S, Kajita M, Tada M, Haraoka Y, Akieda Y, Ishitani T, Fujioka Y, Ohba Y, Yamada S, Hosokawa Y, Toyama Y, Matsui T, Fujita Y (2020)
Calcium Wave Promotes Cell Extrusion.
Curr. Biol. 30, 670-681.
Griffiths VA, Valera AM, Lau JYN, Ros H, Marin B, Baragli C, Coyle D, Evans GJ, Konstantinou G, Younts TJ, Koimtzis T, Srinivas Nadella KMN, Kirkby PA, Bianco IH and Silver RA.
Real-time 3D movement correction for two-photon imaging in behaving animals.
Nat Methods (2020). doi.org/10.1038/s41592-020-0851-7
Hande Tunbak, Mireya Vazquez-Prada, Thomas Ryan, Adam R. Kampff and Elena Dreosti
Whole-brain mapping of socially isolated zebrafish reveals that lonely fish are
not loners.
eLife (2020);9:e55863 DOI: 10.7554/eLife.55863
Mione MC, Blader P, Del Bene F, Trompouki E and Bianco IH.
Perspectives in zebrafish research.
Frontiers in Cell and Developmental Biology (2020)
Ghosh M and Rihel J
Hierarchical compression reveals sub-second to day-long structure in larval zebrafish behaviour.
eNeuro(2020). https://doi.org/10.1523/ENEURO.0408-19.2020
Dreosti E, Hoffman EJ, and Rihel J
Modelling autism spectrum disorders in zebrafish.
In: Gerlai RT (ed). Behavioral and Neural Genetics of Zebrafish(2020). San Diego: Elsevier Inc./Academic Press: pp-pp. 451-471
Lyons DG and Rihel J
Sleep circuits and physiology in non-mammalian systems.
Current Opinion in Physiology (2020).https://doi.org/10.1016/j.cophys.2020.03.006
Antinucci P*, Dumitrescu AS*, Deleuze C, Morley HJ, Leung K, Hagley T, Kubo F, Baier H, Bianco IH*, Wyart C*.
A calibrated optogenetic toolbox of stable zebrafish opsin lines.
eLife (2020) 9:e54937 10.7554/eLife.54937
Folgueira M, Riva-Mendoza S, Ferreño-Galmán N, Castro A, Bianco IH, Anadón R and Yáñez J. Anatomy and Connectivity of the Torus Longitudinalis of the Adult Zebrafish.
Front. Neural Circuits (2020) 14:8. doi:10.3389/fncir.2020.00008
Schwayer C, Shamipour S, Pranjic-Ferscha K, Schauer A, Balda M, Tada M, Matter K, Heisenberg CP (2019)
Mechanosensation of tight junctions depends on ZO-1 phase separation and flow.
Cell 179, 937-952.
Gebhardt C, Auer TO, Henriques PM, Rajan G, Duroure K, Bianco IH*, Del Bene F*.
An interhemispheric neural circuit allowing binocular integration in the optic tectum.
Nature Communications (2019) 10, 5471.
doi:10.1038/s41467-019-13484-9
Shibata-Germanos, S., Goodman, J.R., Grieg, A. et al.
Structural and functional conservation of non-lumenized lymphatic endothelial cells in the mammalian leptomeninges.
Acta Neuropathol (2019). https://doi.org/10.1007/s00401-019-02091-z
Antinucci P, Folgueira M, Bianco IH.
Pretectal neurons control hunting behaviour.
eLife (2019) 8 doi.org/10.7554/eLife.48114
Sabine Reichert, Oriol Pavón Arocas, Jason Rihel
The Neuropeptide Galanin Is Required for Homeostatic Rebound Sleep following Increased Neuronal Activity
Neuron (2019) DOI:https://doi.org/10.1016/j.neuron.2019.08.010
Ingrid Lekk , Véronique Duboc, Ana Faro, Stephanos Nicolaou, Patrick Blader, Stephen W Wilson.
Sox1a mediates the ability of the parapineal to impart habenular left-right asymmetry.
eLife 2019;8:e47376 DOI: 10.7554/eLife.47376
Henriques PM, Rahman N, Jackson SE, Bianco IH.
Nucleus Isthmi is required to sustain target pursuit during visually guided prey-catching.
Current Biology (2019) 29:1771-1786. doi.org/10.1016/j.cub.2019.04.064
Lau JYN, Bianco IH, Severi KE.
Cellular-level understanding of supraspinal control: what can be learned from zebrafish?
Curr Opin Physiol (2019) 8:141 doi.org/10.1016/j.cophys.2019.01.013
Young RM, Hawkins TA, Cavodeassi F, Stickney HL, Schwarz Q, Lawrence LM, Wierzbicki C, Cheng BY, Luo J, Ambrosio EM, Klosner A, Sealy IM, Rowell J, Trivedi CA, Bianco IH, Allende ML, Busch-Nentwich EM, Gestri G, Wilson SW.
Compensatory growth renders Tcf7l1a dispensable for eye formation despite its requirement in eye field specification.
Elife. (2019) 8. doi: 10.7554/eLife.40093
Turner KJ, Hoyle J, Valdivia LE, Cerveny KL, Hart W, Mangoli M, Geisler R, Rees M, Houart C, Poole RJ, Wilson SW, Gestri G.
Abrogation of Stem Loop Binding Protein (Slbp) function leads to a failure of cells to transition from proliferation to differentiation, retinal coloboma and midline axon guidance deficits.
PLoS One. 2019 Jan 29;14(1):e0211073. doi: 10.1371/journal.pone.0211073. eCollection 2019.
Contact
Contact
Contact Us
Tube The nearest underground stations are Euston Square, Euston and Warren Street. We are only a few blocks away from any of these stations.
Buses Southbound routes 10, 24, 29, and 73 pass by UCL’s main gate; northbound routes stop at Warren Street station.
1st Floor, Anatomy Building
UCL
Gower Street
WC1E 6BT
tel: 020 3549 5652
General & technical enquiries
email: g.powell@ucl.ac.uk
Gareth Powell
Outreach/ Work experience/Academic Enquiries
email: g.powell@ucl.ac.uk
Gareth Powell
For information specific to a research group...
Wilson lab s.wilson@ucl.ac.uk
Bianco lab i.bianco@ucl.ac.uk
Tada lab m.tada@ucl.ac.uk
Dreosti lab e.dreosti@ucl.ac.uk
Rihel lab j.rihel@ucl.ac.uk
Alexandre lab p.alexandre@ucl.ac.uk
Hawkins lab t.hawkins@ucl.ac.uk
Payne Lab e.payne@ucl.ac.uk
Frankel Lab p.frankel@ucl.ac.uk
MacDonald Lab ryan.macdonald@ucl.ac.uk
Tuschl Lab k.tuschl@ucl.ac.uk
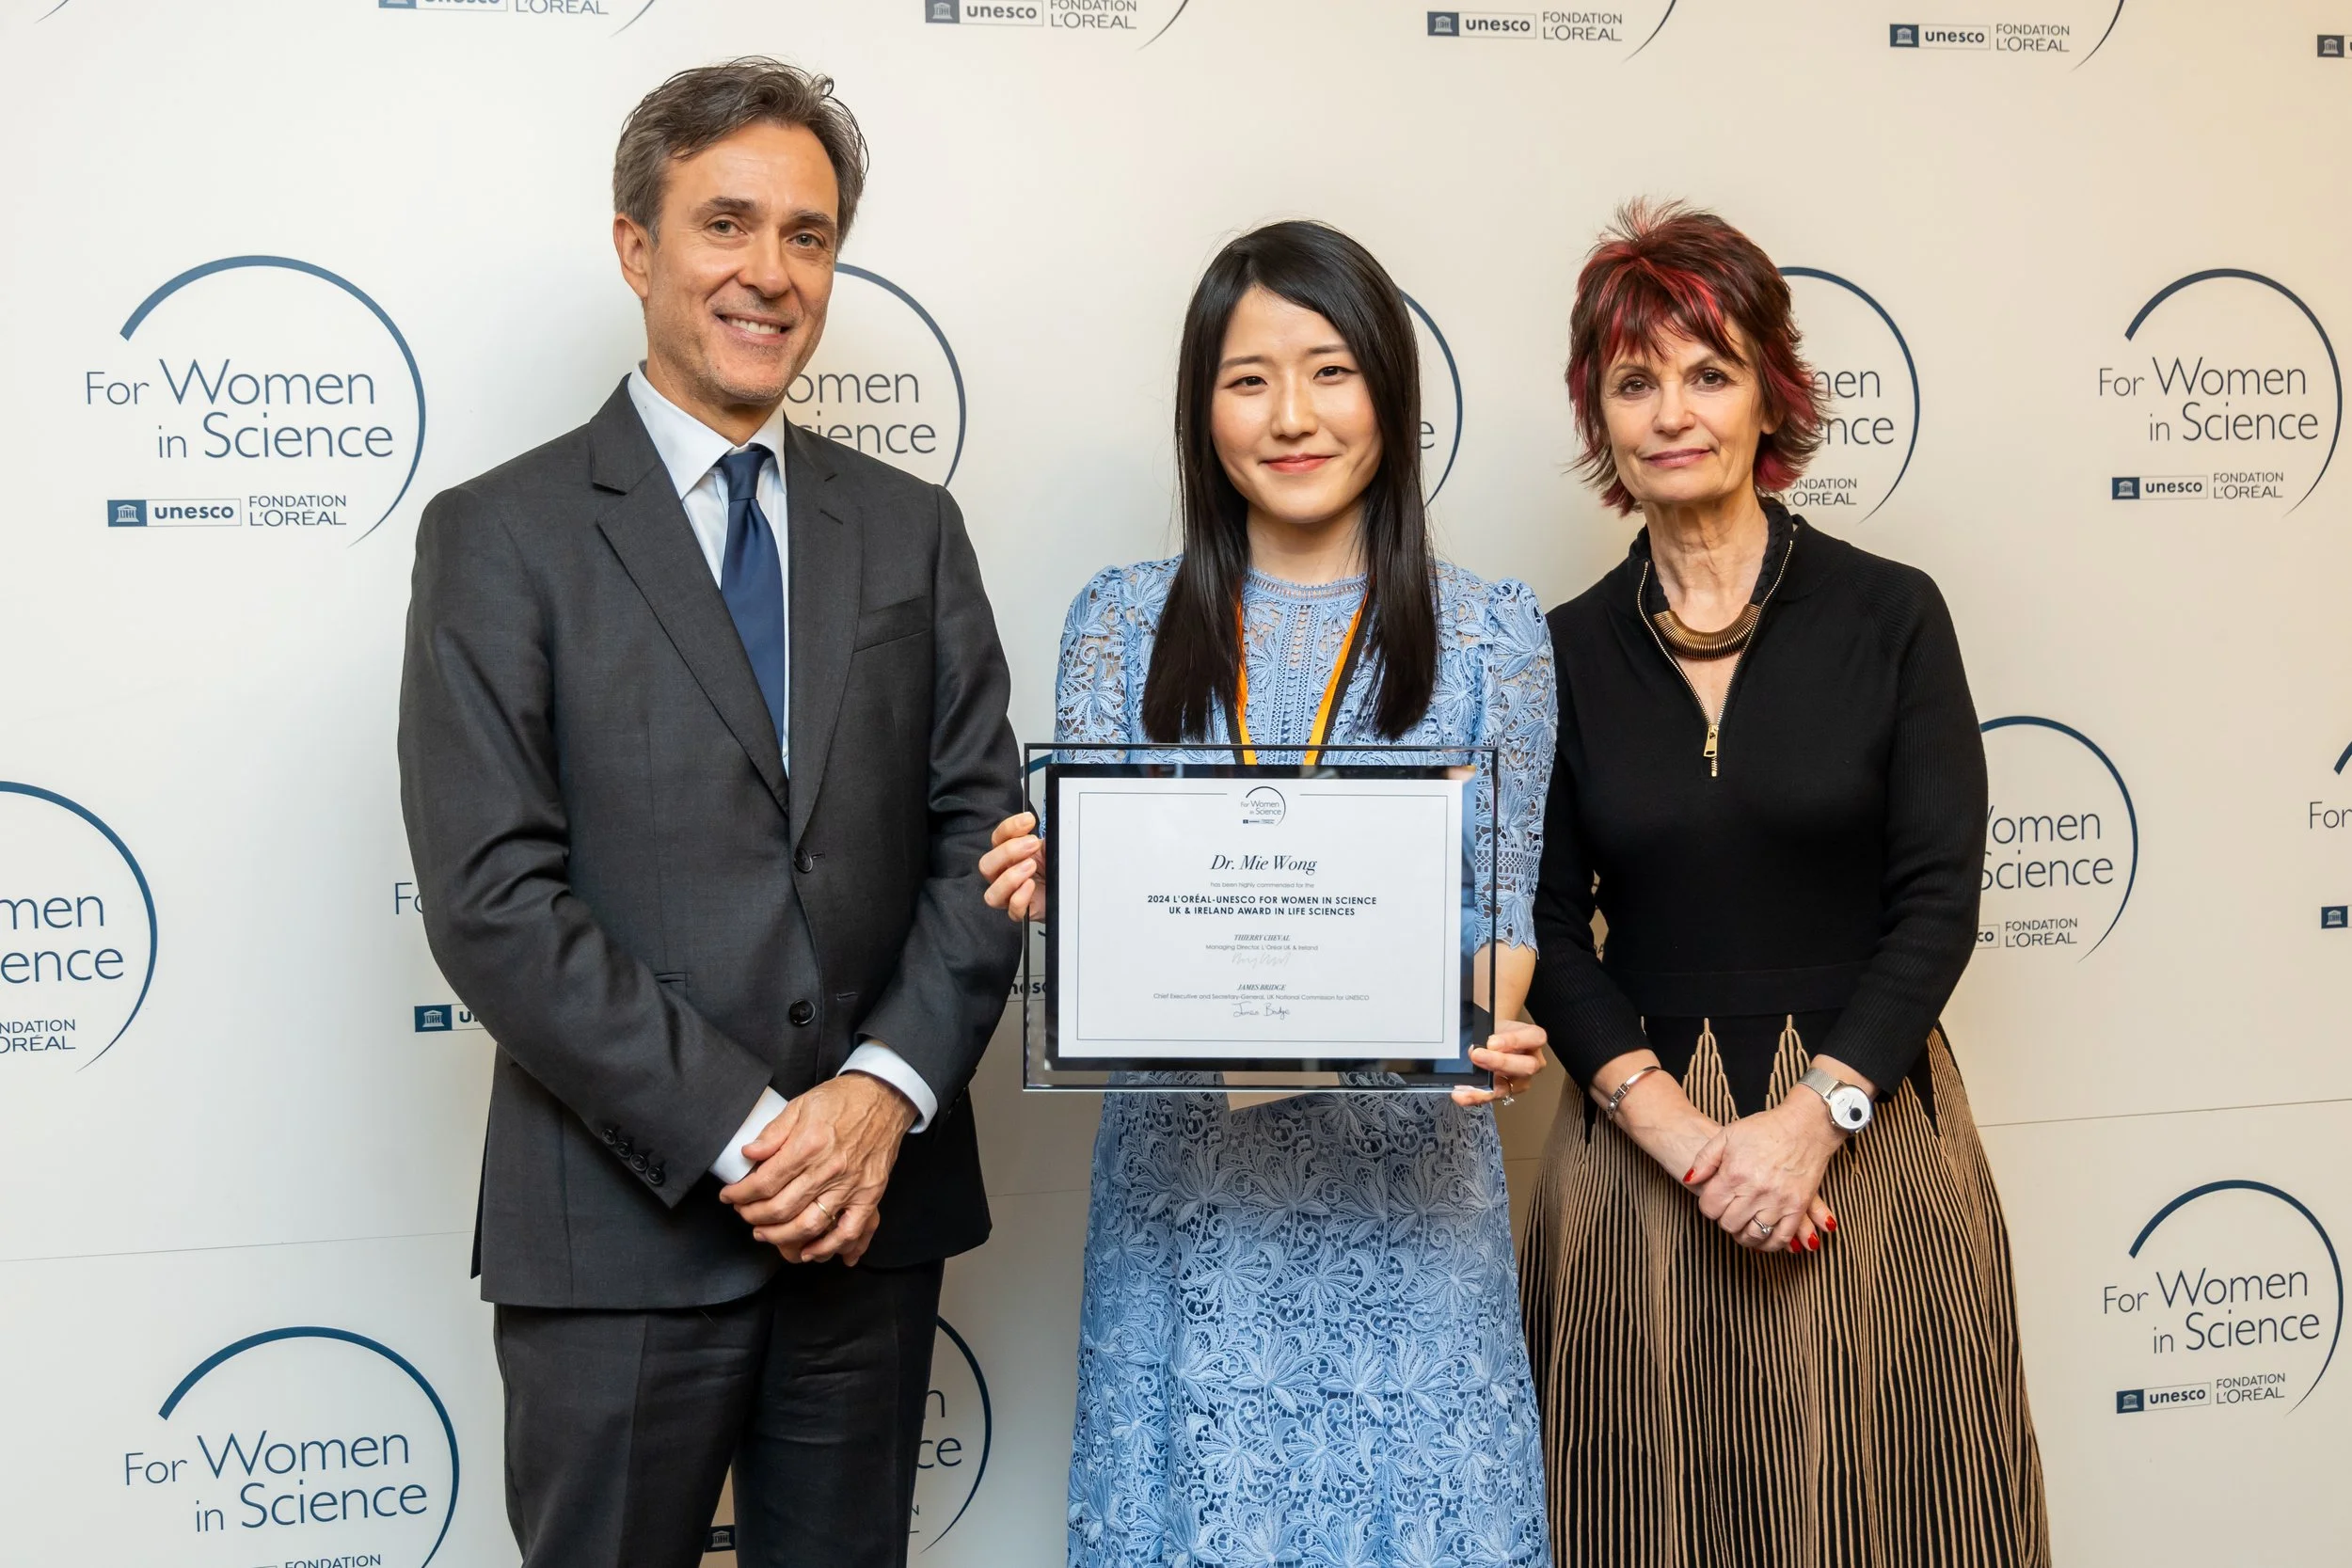
Wong Lab mie.wong@ucl.ac.uk
Mongera Lab a.mongera@ucl.ac.uk