April 2007: NEW VERSION OF HJCFIT,
and of the MANUAL.
HJCFIT will now plot, from the fitted rate constants, the equilibrium Popen with and without exact missed event correction. For an example, see Figure 8 in Burzomato et al, 2004.
|
|
These programs have been written over the last 20 years for analysis of our own results. They all do some things that are still not available in any commercial program.
The programs are written in protected-mode 32-bit Fortran 90, with some assembler subroutines for fast graphics, and the Gino graphics library. Thus they are essentially DOS programs, though they are usually run from Windows, either via a desktop icon (the .ico files) or in the DOS box.
The manuals (now in pdf format), have now all been collected into a single document, DCMANUALS.PDF, which should be downloaded, and the bits that you need can then be printed. Note that some sections are common to many or all programs, e.g. the notes on the graph and histogram drawing subroutines, and it is important to read this before using any of the programs (though there is a lot of online help (hit F1) for the graphics, and also in SCAN.
For setup procedures read : Program Installation Guide
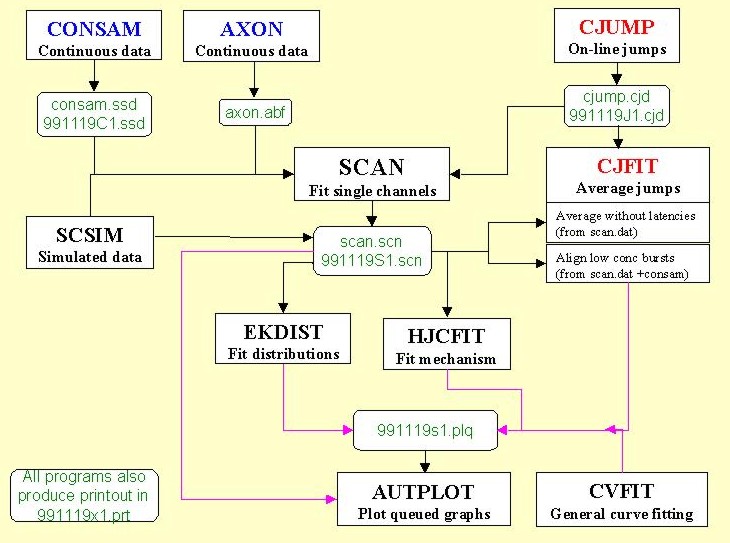
The diagram shows the relationship between the various programs (with default, and typical file names in green). Brief descriptions of the programs, and some screen shots, follow below.
![]() SCAN.
SCAN.
| Click for screenshots |
| Latest changes |
This is our 'idealisation' program. It converts a raw single channel recording into a list of shut times, open times and amplitudes (a .scn file) that is used for subsequent analyses.
Time course fitting of single channel records (see Colquhoun & Sigworth, 1995). This is the only available program for time-course fitting. An earlier (PDP) version of this program is what allowed Colquhoun & Sakmann (1985) to fit shut times down to tau = 9 microseconds, in their analysis of channel openings at the frog neuromuscular junction.

Use of 50% threshold crossing is fine if (a) you aren't fussy about getting the maximum possible time resolution, and (b) subconductance levels are rare. As all of our records (for NMDA, neuronal nicotinic and glycine receptors) contain many sublevels, threshold methods are not much use. Time course fitting is probably the only way of fitting records that contain many subconductance levels without imposing any preconceptions about where the levels are. It measures what you have actually got, not what you might have had if channels were always simple and stable in their behaviour. Amplitude stability plots, as available in EKDIST, show that amplitudes are quite often not stable throughout a long recording.
Data are sampled via CED interface with CONSAM (consam.ssd file), or can be read from an Axon continuous sample file. This produces a summary file (scan.scn) which acts as input for the distribution-fitting program (EKDIST), and for the mechanism-fitting program (HJCFIT). The same file also allows a SCAN analysis to be restarted where you left off. There is a fairly complete user manual for SCAN
SCAN can also fit single channels that are elicited by a concentration or voltage jump (see cjump5.exe).
Warning. Some idealisation programs produce time intervals that are rounded to the nearest integer multiple of the sample interval. For example, if the raw data are sampled at 40 kHz, the durations of open and shut times all come out as 25, 50, 75 . . . microseconds. This wastes an enormous amout of information about fast events and is thoroughly undesirable. Some threshold-crossing programs do this, though the better ones don't. The SKM method of idealisation (part of the QUB suite) also has this unfortunate property, Caveat emptor!
NEW Demonstration files are provided on the download page to allow SCAN to be tried out painlessly.
Top | Read notes | Register | Download
![]() EKDIST.
EKDIST.
| Latest changes |
EKDIST is used for fitting of many sorts of distributions to the output from SCAN (a SCAN.SCN file). It fits mixtures of exponential distributions to dwell time, mixtures of geometric distributions to discrete distributions (such as the number of apparent openings per burst), and mixtures of gaussians to amplitude distributions. EKDIST also does stability plots (for amplitudes and durations), many sorts of burst analysis, subconductance transition listing (and 3D plotting), correlations of various types, including 3D bivariate distributions and dependency plots. It has far more options than any commercial program for the empirical fitting of single channel data. Top | Read notes | Register | Download
![]() SCANFIX.
Small utility to list, and if necessary correct, the header data in the new format output files from SCAN (SCAN.SCN files).
SCANFIX.
Small utility to list, and if necessary correct, the header data in the new format output files from SCAN (SCAN.SCN files).
![]() SCDIR.
Small utility, to list the directory of experiments on a
scandat.dat file (the old data format for output from SCAN, not used in current version).
SCDIR.
Small utility, to list the directory of experiments on a
scandat.dat file (the old data format for output from SCAN, not used in current version).
![]() PLOTSAMP.
Stand alone program to plot an entire single channel record with specified number of seconds per page, lines per page, and line separation (on screen or plotter). This can also be done in AUTPLOT (see below).
PLOTSAMP.
Stand alone program to plot an entire single channel record with specified number of seconds per page, lines per page, and line separation (on screen or plotter). This can also be done in AUTPLOT (see below).
![]() CONSAM
CONSAM![]() (see below). To
sample data continuously to hard disk via CED1401 interface.See
also Further notes on programs that use
the 1401-Plus Interface
(see below). To
sample data continuously to hard disk via CED1401 interface.See
also Further notes on programs that use
the 1401-Plus Interface
![]() FILTSAMP.
FILTSAMP.
Utility to omit points from and/or filter (with a digital Gaussian filter) a continuously sampled record (e.g. consam.ssd file, Axon continuous data (.abf) file), or ASCII file (previously called FILTSAM)
April 2007 update now available (click here for a pdf file that explains main changes)
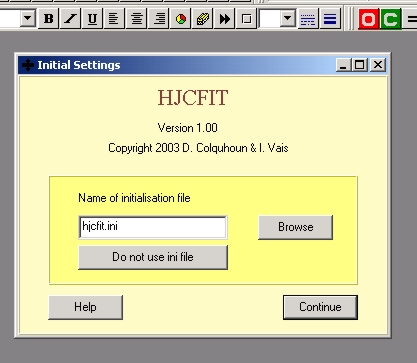
![]() HJCFIT.
HJCFIT.
Full maximum likelihood fitting of a mechanism directly to the entire sequence of open and shut times, with exact missed events correction.
The name of the program is an acronym for Hawkes, Jalali & Colquhoun, whose papers in 1990 and 1992 described the exact solution of the missed event problem, which is the basis of the program. Other programs continue to use approximations.
The input for HJCFIT is the list of idealised open and shut times from SCAN (scan.scn file). The current version can now also read events list files from Strathclyde (Dempster) programs (.ede files), and from pClamp (.evl files).
Note, though, that the pClamp (.evl files), and also the hidden Markov idealisation method (SKM method in QUB suite), store event durations as an integer number of sample points which places a severe limit on the resolution of fast events. This way of storing durations is a great waste of information, and quite unnecessary. The better threshold crossing programs, and, of course, SCAN, store times as a continuous variable. The problems caused by rounding short intervals in this way are illustrated in Figure 11 of Schorge et al., 2005.
The HJCFIT method was first described in Colquhoun, Hawkes & Srodzinski 1996). The properties of the estimates of rate constants obtained by this method have now been evaluated (Colquhoun, Hatton & Hawkes, 2003). It is the only method of its sort that has been so tested.
The HJCFIT method has been used to evaluate rates for binding and gating of glycine receptor channels
Demonstration files are provided on the download page to allow you to estimate rate constants from data with HJCFIT by doing little more than hitting 'enter' repeatedly (all the necessary inputs are supplied by the .ini file).
Some advantages of HJCFIT, compared with its only rival, the MIL program (part of the QUB set of programs)(1) The distributions of estimates from HJCFIT have been investigated (see Colquhoun et al, 2003), whereas those from MIL have not.(2) The HJCFIT program incorporates the ability to do repeated simulations of the sort described by (Colquhoun et al., 2003) for essentially any mechanism and values of rate constants, so you can investigate the quality of estimates for your problem. For example, HJCFIT can be set to generate 1000 'experiments' and fit them, unattended. A utility program, SIMAN.EXE, is available to inspect the outcome of such simulations. (3) The missed event correction used by HJCFIT is exact, whereas that used by MIL is approximate. Strictly speaking the asymptotic form, used in HJCFIT for intervals longer than 3 times the resolution, is an approximation (e.g. this is used for intervals longer than 90 microseconds if the resolution is 30 microseconds). But HJCFIT allows a visual check that the asymptotic form is essentially identical with the exact form in the region that is used (e.g. Fig. 6B in Colquhoun et al, 2003). The asymptotic form has the advantage that it has the form of (the right number of) exponential components, the times constants and areas of which are printed. The practical importance of this difference in method for making the missed event correction has not been investigated. (4) In HJCFIT the start and end vectors for each group of openings can be calculated from the exact HJC theory. This does not matter much if the groups of openings are long (as is usually the case in high concentration records) but it is shown by Colquhoun et al ( 2003) to be of great importance when individual activations are fitted as a group at low agonist concentrations. This feature allows records to be used when they contain an unknown number of channels. (5) In HJCFIT it is possible to use a specified value of an EC50, determined independently, to calculate the value of any specified rate constant from the values of all the others. This reduces by one the number of free parameters that have to be estimated. (6) In HJCFIT, the whole covariance matrix is calculated at the end of a fit, so as well as approximate standard deviations for the estimates, the correlation coefficients between all possible pairs of estimates are also printed. These can be very useful for detection of poorly defined parameters, as shown by Colquhoun et al. (2003).
(7) In HJCFIT there are more ways to test the quality of the
fit, once it has been done. Whereas MIL displays only open
and shut time distributions at the end of a fit, HJCFIT can
display also the following tests. In all of these cases the prediction of the observed distributions is calculated from the fitted rate constants (and the resolution) by exact HJC methods. (8) HJCFIT and theory programs can use the spanning tree method to identify independent cycles for the purposes of maintaining microscopic reversiblity for mechanisms of any complexity (see Biophysical Journal paper). MIL appears to use a method similar that given in appendix 2 of this paper, which is equally satisfactory (Qin et al., 1996, Biophys, J., 70, 246-280). (9) HJCFIT can estimate rate constants as fast as 130 000 s—1 (which corresponds to a time constant of 7.7 microseconds) from data with a resolution of 30 microseconds. This is demonstrated by analysis of data, and by repeated fits to simulated data, from experiments on the heteromeric glycine receptor (Burzomato et al., 2004). In contrast, the QUB equivalent, MIL, can not get much beyond 20 000 s—1, not fast enough to estimate the opening rate constant for acetylcholine as a free parameter. |
Disadvantages of HJCFIT, compared with MIL(1) It is a DOS program, which many people are not familiar with (but run through the demonstration program on the download page for a painless introduction). This is, in some ways, an advantage. Many inputs have to be set before you can start fitting, and a DOS program leads you through the inputs in a logical order, the questions to be answered depending on earlier choices. It is hard to do this so clearly in a Windows programs, because they are not sequential so there is no logical order, and this can be confusing. In most Windows programs, such as Powerpoint and Word, this can be dealt with by having default settings for everything (why are they never the ones that you want?), but in science there are no natural defaults. We are working on a WIndows version (see below), but it will it will take some time before it is ready.(2) The 'mechanism designer' in the present version of HJCFIT can deal (graphically) only with mechanisms that can be drawn on a plane (the Windows version allows 3D mechanisms to be designed, much as in MIL). (3) MIL can deal with multiple conductance levels, whereas HJCFIT cannot. For this purpose MIL uses an approximate missed event correction. The theory for the exact missed event correction with multiple conductance levels has been done (Merlushkin, A. & Hawkes, A. G., 1997. Stochastic behaviour of ion channels in varying conditions. IMA Journal of Mathematics Applied in Medicine & Biology 14, 125-149), but it has not yet been incorporated into HJCFIT. |
| The Windows version of HJCFIT is now available here. |
|
Now available
![]() CJUMP5.
Runs a voltage and/or concentration jump experiment on-line, with the CED1401plus interface. The F90/Gino version is now available for download. See also Further notes on
programs that use the 1401-Plus Interface
CJUMP5.
Runs a voltage and/or concentration jump experiment on-line, with the CED1401plus interface. The F90/Gino version is now available for download. See also Further notes on
programs that use the 1401-Plus Interface
CJFIT. To
analyse and fit output from CJUMP5. It allows various sorts of averaging and fiiting of exponentials.
![]() CVFIT
CVFIT
| Click for screenshots |
CVFIT is a general purpose curve fitting program that is good on (a) weighting options, (b) simultaneous fits of several data sets with parameters in common (eg to constrain curves to be parallel); a particular example is the option to fit the Schild equation directly to a set of concentration-response curves (rather than to a Schild plot), and (c) it is the only program I know of that will calculate likelihood intervals for the estimated parameters (as well as their approximate SD). It has 30 or so equations built in (but no option to add your own -you have to ask us nicely if you want a different one).
Download a pdf file that describes a case study of methods of fitting the Schild equation (methods that CVFIT can do).
Technical notes about using CVFIT for such fitting can be downloaded here
Top | Read notes | Register | Download
RANTEST
Does a two-sample randomisation test and displays the randomisation distribution. It works on paired or unpaired data with continuous variables to provide a better test then Student's t test . It has recently been changed so that it will also analyse the difference between two (binomial) proportions. This sort of analysis is commonly done in the form of a 2x2 table by chi-squared or Gaussian approximation to the binomial, but it has been known for a long time that the Fisher Exact test is the best way to do it. This option in RANTEST provides a Monte Carlo version of the Fisher Exact test which obviates the need for Tables and will work with any sample size.![]() AUTPLOT
AUTPLOT![]()
All programs offer the option to queue graphs for plotting later (in a file called, by default, plotq.plq). The plotting of the graphs from this file is done by AUTPLOT. The plots can be done automatically (e.g. 20 graphs, whole page or four per page, without intervention). They can also be plotted manually (in the subroutine that originally produced them) to allow labels, arrow, text etc to be added. This applies to graphs and histograms (produced by the vplot and vhist subroutines), and now 3D plots (produced by the gplot3d subroutine). These graphics subroutines are common to all programs.
Single channel records queued in SCAN can also be plotted in AUTPLOT (mixed with graphs, histograms and 3D plots if you wish). The single channel data can be altered, by taking a longer or shorter part of the original record than was originally queued, and multi-line plots can be made (of the whole run if you wish).
There is also an option to plot out the entire raw data from a
jump experiment (see CJUMP5) to make a summary of the experiment
Top |
Read notes |
Register |
Download
(d) Noise analysis
Not yet converted from PDP to PC versions!
(e) Ion channel theory programs
These programs do various
calculations for macroscopic and single channel behaviour, based
on Colquhoun & Hawkes equations. Any mechanism can be specified, and these defined mechanisms can be used by any of the programs to make predictions.
The latest versions of SCALCS. SCBST, SCJUMP and SCCOR now take up to 100 states, and provision for giving realistic names to the states and to ligands has been added (seeDCMANUALS.PDF for details).
SCALCS. Calculates and plots the macroscopic response to jumps or pulses in agonist concentration, and also equilibrium and peak concentration response curves (with Hill slope as a function of concentration). Also calculates the expected noise spectral density (as in Colquhoun & Hawkes, 1977, 1995a,b)
SCBST. Calculates properties of bursts of openings (as in Colquhoun & Hawkes, 1982)
SCJUMP. Calculates properties of single channel elicited by a concentration jump (as in Colquhoun et al. , 1997)
SCSIM Calculates a simulated series of openings and shuttings (simulated output from SCAN), and puts the results in a scan.scn file for analysis by EKDIST or HJCFIT.
SCCOR Calculate properties of correlations between open times, shut times, burst lengths, openings within a burst etc. (see Colquhoun & Hawkes, 1987)
Top | Read notes | Register | Download
Colquhoun, D. & Hawkes, A. G. (1977). Relaxation and fluctuations of membrane currents that flow through drug-operated channels. Proceedings of the Royal Society London B 199, 231-262.[Abstract]
Colquhoun, D. & Hawkes, A. G. (1982). On the stochastic properties of bursts of single ion channel openings and of clusters of bursts. Philosophical Transactions of the Royal Society London B 300, 1-59.[Abstract] [Get PDF (6 Mb!)]
Colquhoun, D. & Sakmann, B. (1985). Fast events in single-channel currents activated by acetylcholine and its analogues at the frog muscle end-plate. Journal of Physiology (London) 369, 501-557. [Abstract] [Medline]
Colquhoun, D. & Hawkes, A. G. (1987). A note on correlations in single ion channel records. Proceedings of the Royal Society London B 230, 15-52. [Abstract] [Medline]
Colquhoun,D; Hawkes,AG (1995a): The principles of the stochastic interpretation of ion channel mechanisms. In: Single Channel Recording. 2nd ed. (Eds: Sakmann, B., Neher, E.) Plenum Press, New York, pp. 397-482.
Colquhoun,D; Hawkes,AG (1995b): A Q-matrix Cookbook. In: Single Channel Recording. 2nd ed. (Eds: Sakmann, B., Neher, E.) Plenum Press, New York, pp. 589-633.
Colquhoun, D. & Sigworth, F. J. (1995). Analysis of single ion channel data. In Single Channel Recording,2nd ed. (Eds: Sakmann, B., Neher, E.) Plenum Press, New York, pp. 483-587.
Colquhoun, D., Hawkes, A. G. & Srodzinski, K. (1996). Joint distributions of apparent open times and shut times of single ion channels and the maximum likelihood fitting of mechanisms. Philosophical Transactions of the Royal Society London A 354, 2555-2590. [Abstract]
Colquhoun, D., Hawkes, A. G., Merlushkin, A. & Edmonds, B. (1997). Properties of single ion channel currents elicited by a pulse of agonist concentration or voltage. Philosophical Transactions of the Royal Society London (Physical Sciences) A 355, 1743-1786. [Abstract]
| Pharmacology Main Page | Research | Ion channels | Top |