Close
Close

UCL EGA Institute for Women's Health
EGA Institute for Women's Health 2020-2022 report
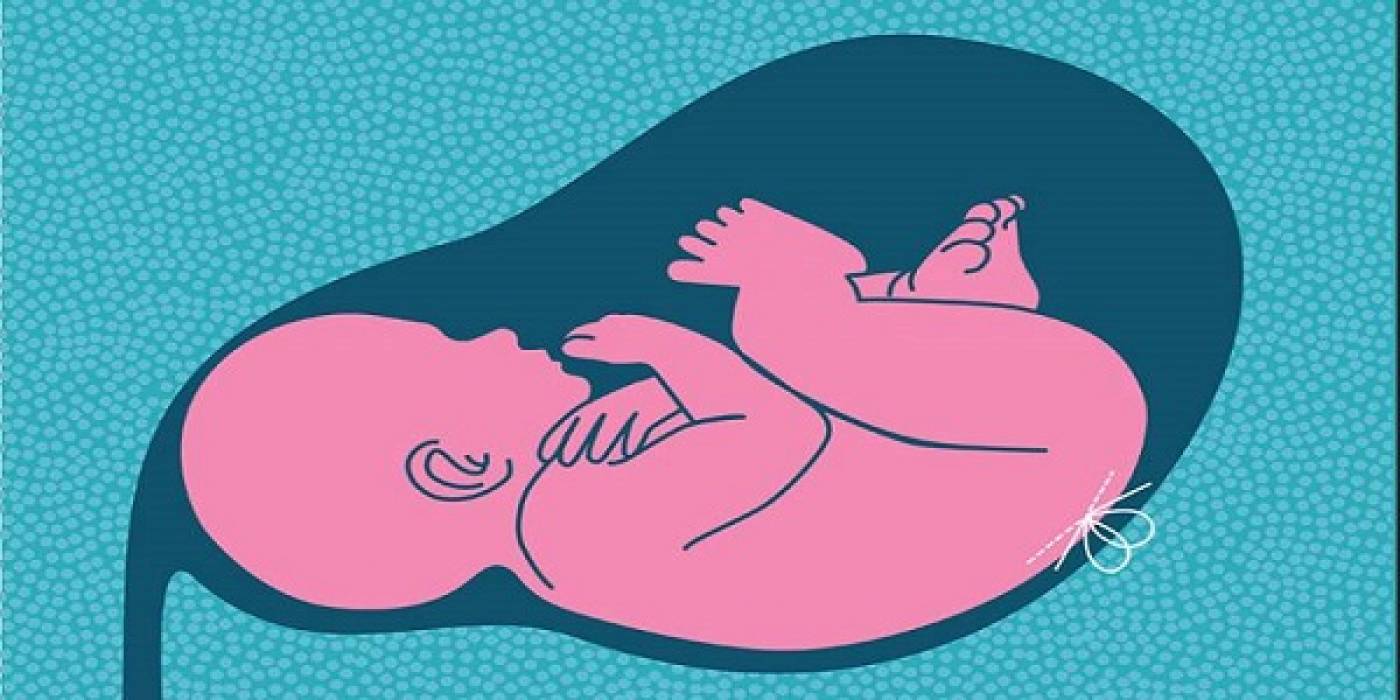
Centre for Prenatal Therapy - The first open fetal surgery for spina bifida in the UK
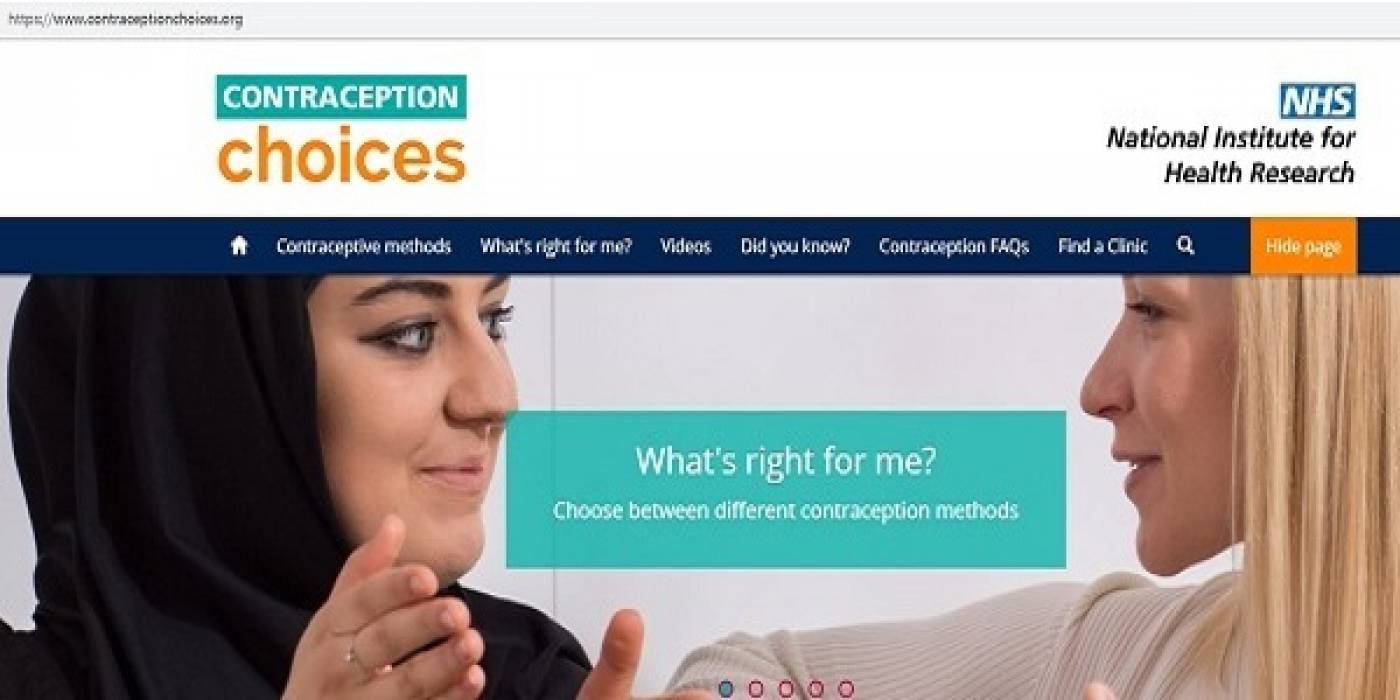
Lead website for Contraception advice on NHS Choices
UKCTOCS - Largest ever randomised controlled trial in ovarian cancer screening
The EPICure Studies - studies of survival and later health in babies & young people born extremely premature
https://www.ucl.ac.uk/womens-health/research/maternal-and-fetal-medicine/prenata...
Maternal and Fetal Adverse Event Terminology (MFAET)