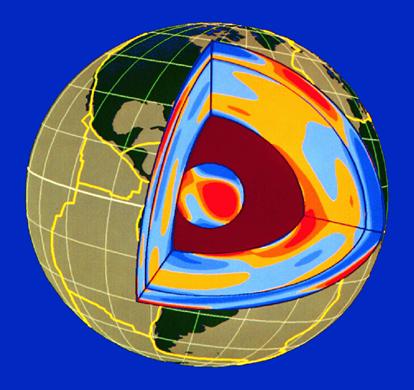
The Deep Earth
Observations
|
Mean
radius = 6371 km |
Mass
= 5.97 x 1024 kg |
|
Density
surface rocks = 2-3 x 10³ kg m-3 |
Average
density = 5.52 x 10³ kgm-3 |
The deepest
man made hole is about 12 km in the Russian Kola peninsula (1994).
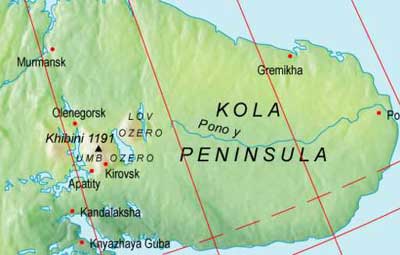
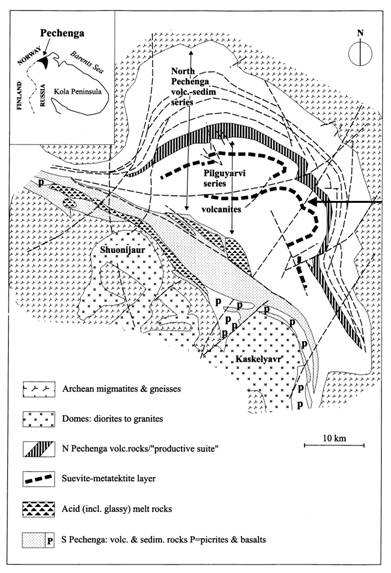
In the Pechenga
Ni-ore province (now known as an impact site!)
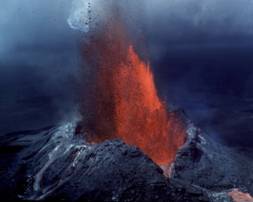
Volcanoes
bring material to the surface from depths of ~100 km.
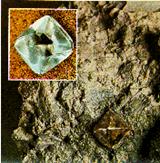
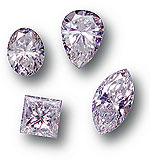
Diamonds may
come from ~400 km.
The rest of
our information about the Earth's interior must come from study of Earthquake
(or nuclear) shock waves, complemented by cosmochemistry and mineral physics.
By studying
how long it takes waves to pass through Earth (travel times) can work out a
model for the internal structure of the planet.
Body
waves - "P-waves" and "S-waves"
Vp
= [K + 4/3µ /ρ] 0.5
Vs = [µ / ρ] 0.5
Vp,s
= velocity; K = bulk modulus, a measure of how material compresses under P; µ =
shear modulus; ρ = density
Since K >
0, Vp > Vs, P = primary. S = secondary or shear
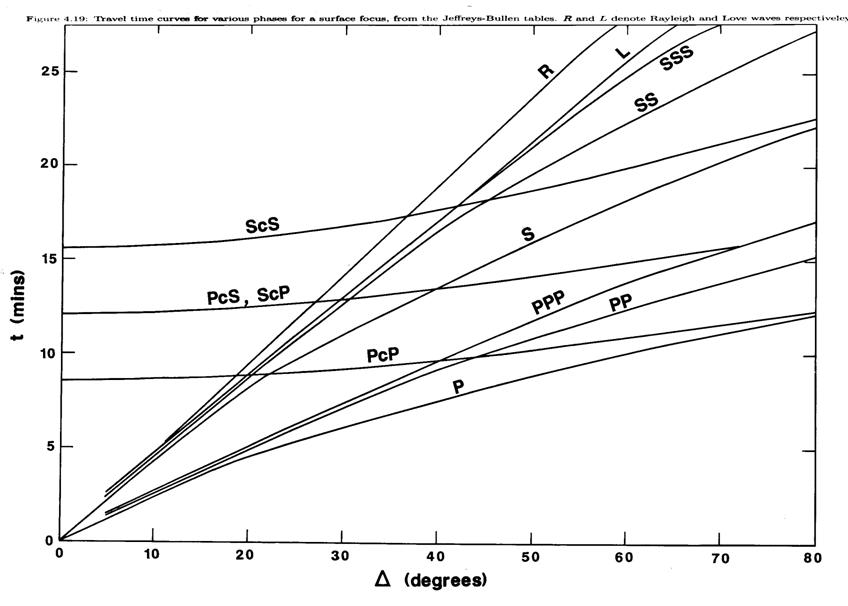
Vp,
etc as a function of depth can be obtained from travel-time curves:
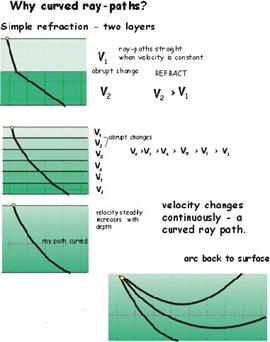
The bending
ray follows a ray path, which is characterised by the ray parameter (p), where:
p = r0/V0
= r sin(i)/V
This is the Benndorf relationship, which relates the
distance from the centre of the Earth at which the ray starts to return to the
surface (r0) and the speed it is traveling with at that depth (V0).
These two terms then also define its speed at shallower depths (r), the angle
of incidence (i) and the velocity (V) at that depth.
Seismic
Structure of the Earth
In Earth,
seismic velocity (V) varies with depth (Z). Seismic waves can be reflected and
refracted at interfaces (cf light). The surfaces between layers are curved, but
principles of refraction and reflection can be used to infer how V varies with
Z, and the depths of layers.
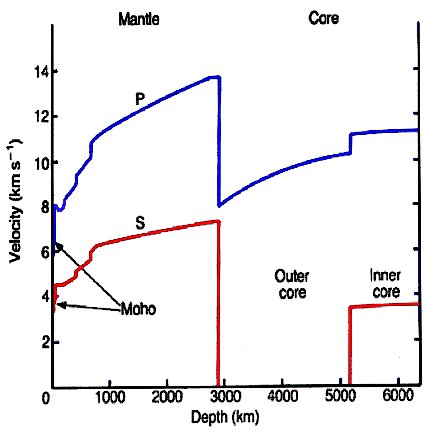
Major result
is a V v Z plot obtained from travel-times.
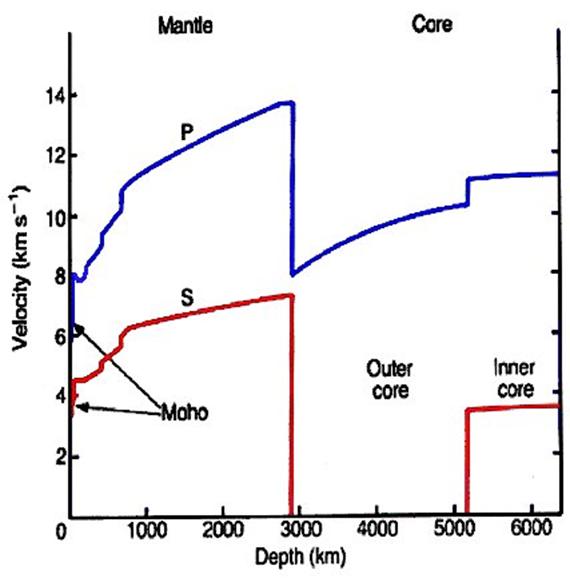
Vp and Vs
tend to vary smoothly over a large part of the Earth but have a number of discontinuities.
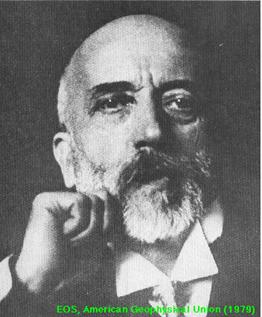
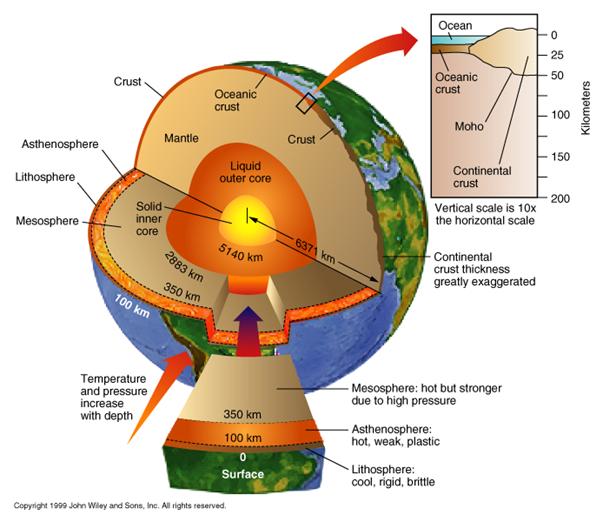
· Mohorovicic discontinuity:
~10-60 km -
marks crust/upper mantle boundary.
At
this depth there a change of seismic wave velocity and also a change in
chemical composition.
Named
after Andrija Mohorovičić, the Istrian seismologist who discovered
it.
The
boundary is ~25-60 km deep beneath the continents and ~5-8 km deep beneath the
ocean floor.
· Low velocity zone:
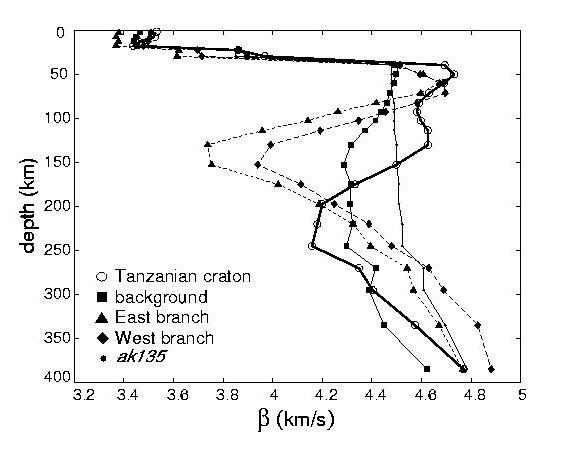 ~ 50-200 km
Shear
wave velocity profile showing LVZ beneath Tanzanian craton.
· Lehmann discontinuity:
~ 220 km
depth. Increase in Vp and Vs by 3-4%. It may not be ubiquitous. It is sometimes
called the after Inge Lehman (who more famously discovered the presence of an
inner core).

· Transition zone:
~400-670 km with
a number of sharp increases in Vp and Vs
· Lower mantle:
~670-2885 km
monotonic increase in Vs and Vp.
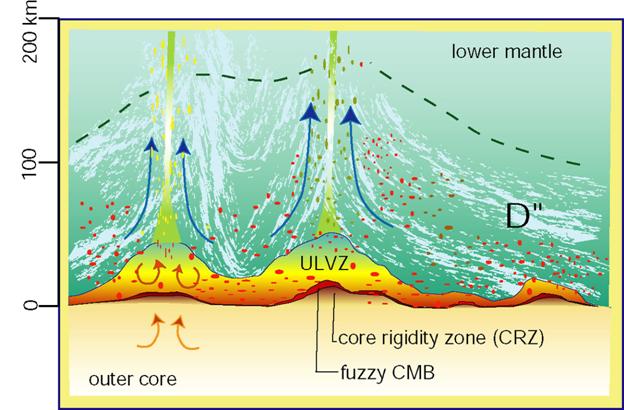
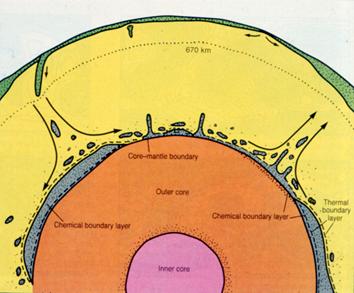
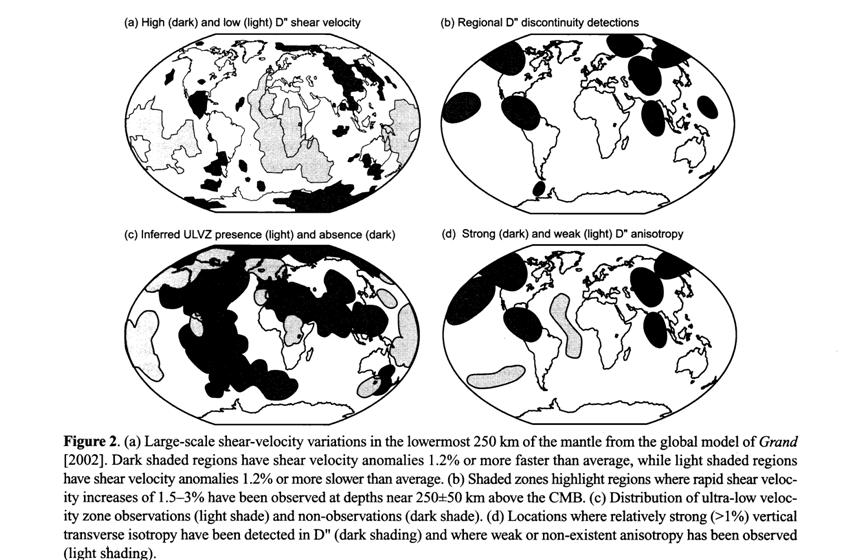
· D:
At CMB have
D an anomalous region just above the CMB with seismically fast and slow
regions, Ultra Low Velocity zones (ULVZ) possibly due to partial melt; this
region also possible slab graveyard, possible perovskite to post-perovskite
transition, possible repository of primordial material
area of very active
research.
· Core-mantle boundary (CMB):
~2885 km, Vs
= 0, Vp drops.
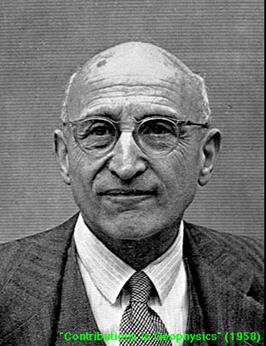
Beno
Gutenberg, who first established the depth of the CMB to be 2880km.
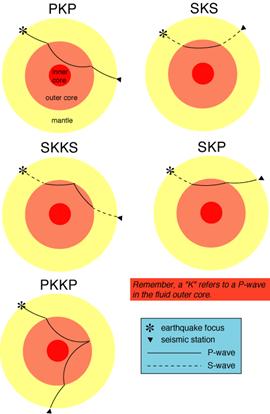
· Outer Core:
~2885-5145 km
Outer core
liquid (S-waves not possible), and has a lower Vp velocity
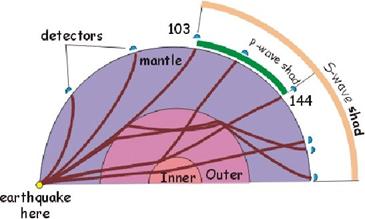
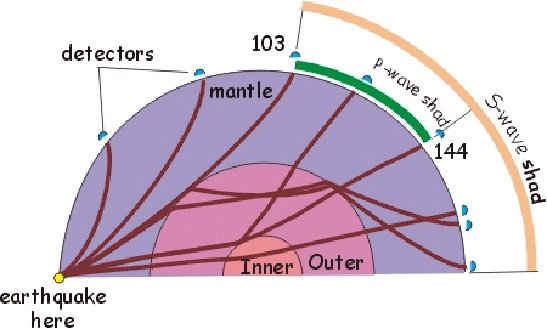
The
region that extends from 103º to 143º from the epicenter of an
earthquake and is marked by the absence of P waves. The P-wave
shadow zone is due to the refraction of seismic waves in the liquid
outer core.
The
region within an arc of 154° directly opposite an earthquake's epicenter that is
marked by the absence of S waves. The S-wave shadow zone is due to the
fact that S waves cannot penetrate the liquid outer core.
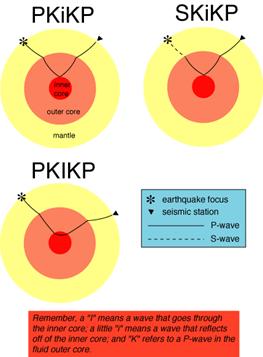
Lehmann saw
P wave arrivals in P-wave shadow zone to infer presence of IC.
· Inner Core:
~5145-6371
km, Vp increases and Vs inferred > 0, -> solid inner core. Even inner
core is not homogeneous. Layered and anisotropic.
Density of the Earth
From the seismic data, it is also possible to work out
the density of the Earth as a function of depth, via data on K, g
.
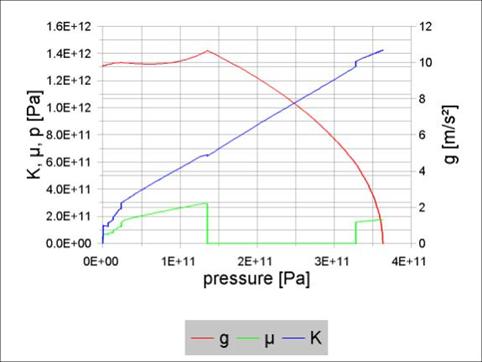
..and the Adams-Williamson relationship:

where
F is the seismic parameter (= VF2 = K/r).
|
Thus,
considering only density changes with depth in the Earth,
From
the hydrostatic
law,
However,
it is also a known function of seismic S and P velocities, so
it can be measured with depth. Plugging (2) and (3) into (1) gives
For
smooth (but not necessarily for discontinuous) r(r), this can be integrated,
using the total mass and moment of
inertia as boundary conditions. This is the Adams-Williamson equation. |
||||||||
|
|

This shows that the density increases from about 3.3
g/cc in the upper mantle, and reaches about 5 g/cc at the CMB.
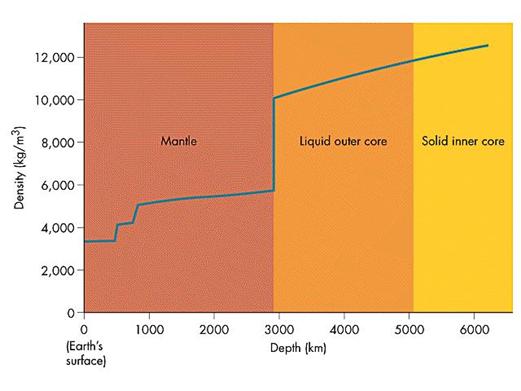
Here there is a major discontinuity with a jump to ~
10 g/cc in the outer core and which rises to ~13 g/cc at the centre of the
Earth.
The average density of the core is approximately 10.8
g/cc.
The inferred
V and r curves are average values for a given depth.
This also
gives P as a function of Depth:
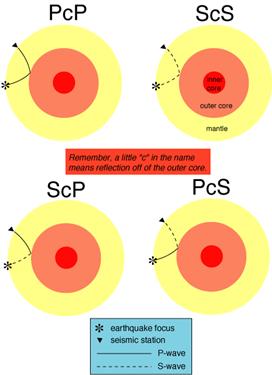
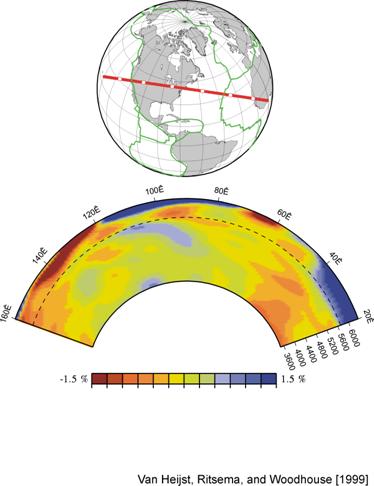
Seismic Tomography
Now know
that there are many seismic ray paths:
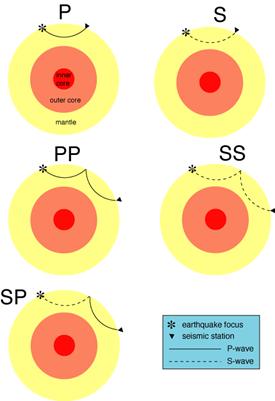
We can
calculate how long they should take to travel certain paths PREM model (via
Preliminary Reference earth Model):
When
measured for any given earthquake, the waves may be faster or slower than
expected:
A full
detailed 3 dimensional set of travel time differences, gives a seismic
tomographic image that reveals local variations in V and r due to
variations in chemical composition or thermal structure.
Generally blue = faster = colder
Red = slower = hotter
The
composition of the Earth
Seismology
shows that the Earth is layered, that it is largely solid and crystalline (LVZ
close to melting, outer core liquid), and that it has a complex but well
defined density structure.
What are the
chemical and mineralogical make up of the following layers:
|
CRUST |
- |
continental |
|
MANTLE |
- |
upper |
|
CORE |
- |
outer |
· Crust
In general:
- continental - inhomogeneous, high SiO2, t = 35 km (25-70
km), mixed ages (oldest 3,800 my)
- oceanic - layered basalts and gabbros, t = 6 km, orderly in age and
structure, young (< 200my)
In places
Moho is a chemical change:
but it may
also be due to a phase change (e.g. basalt -> eclogite)
· Mantle
The Upper
Mantle
Upper mantle
can be sampled directly via:-
(i) Ophiolites and tectonic slices.
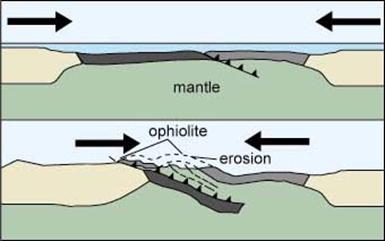
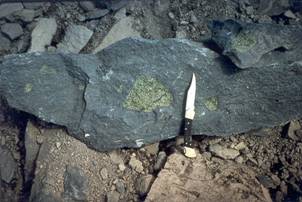
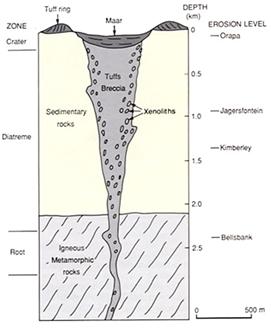
(ii) Inclusions brought up in volcanics, kimberlites, etc.
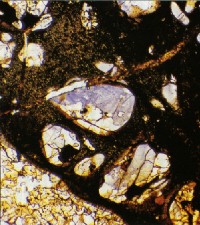
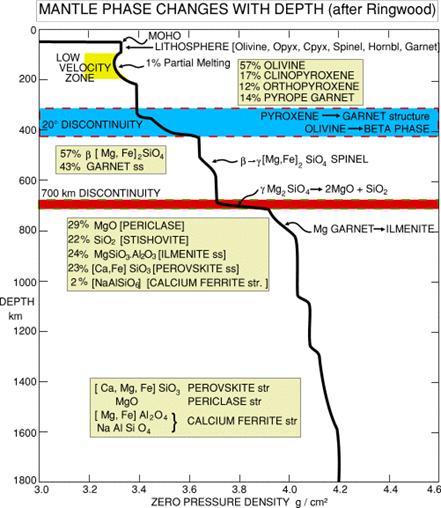
Typical rock
a garnet peridotite made of Mg,Fe silicates
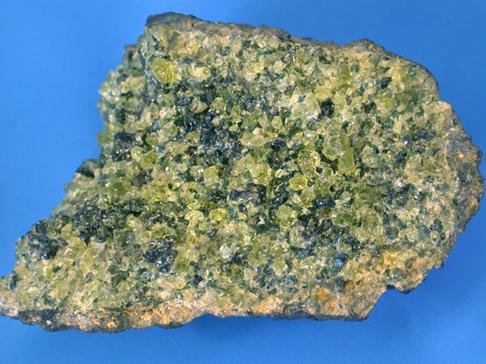
60% olivine (Mg,Fe)2SiO4
18% orthopyroxene (Mg,Fe)SiO3
12% garnet (Ca,Mg,Fe)3Al2Si2O12
10% clinopyroxene Ca(Mg,Fe)Si2O6
Garnet
peridotite (similar to experimentalists pyrolite) partially melts to give
basalt and so is a suitable candidate for upper mantle on petrological grounds
as we know basalt liquid comes from upper mantle to form oceanic crust.
The Upper
Mantle is heterogeneous (with eclogite, dunite, etc.), because of melting to
give basalts and residual rocks.
Density, Vp
and Vs of minerals give an excellent fit to density, Vp and Vs of upper mantle,
so garnet peridotite also satisfies geophysical constraints.
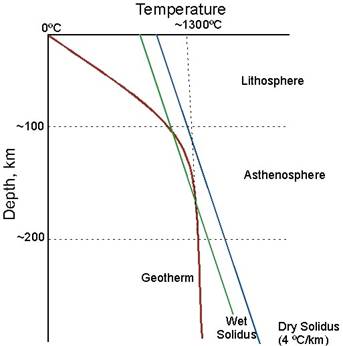
LVZ may be
due to geotherm approaching the solids of slightly hydrous peridotite.
Pre-melting gives rise to anomalous properties.
Transition
Zone
At 400 km
have discontinuity in Vp and Vs. Density increases, this could be due
to:-
(1) same minerals but with higher molecular
weight (i.e. more Fe, less Mg).
(2) structural phase change to a more densely packed structure.
(3) a combination of (1) and (2).
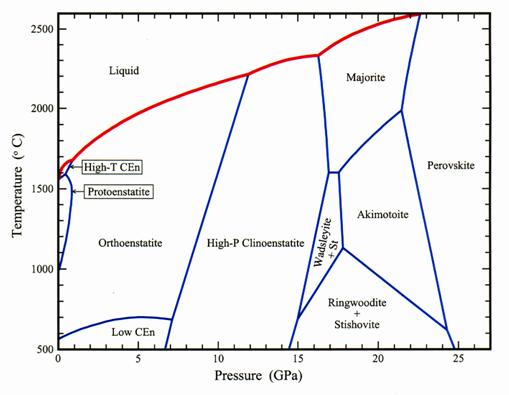
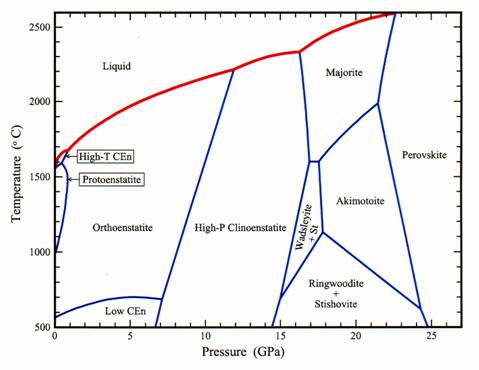
What happens to olivine if it is subjected to P + T of
transition zone?
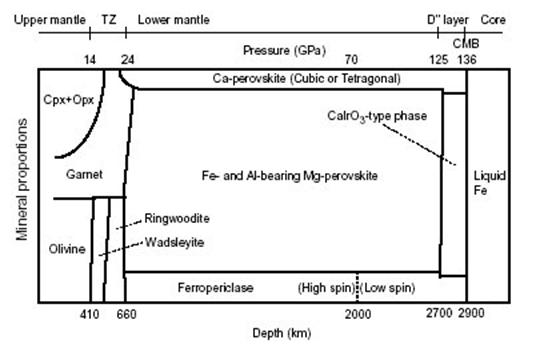
At about 120
kb + 1400°C (400 km)
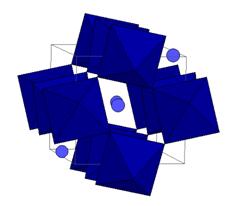
Forsterite -> Beta-Mg2SiO4 (wadsleyite)
At P, T
about 550 km:
Beta-Mg2SiO4 -> Spinel-Mg2SiO4
(ringwoodite)
Wadsleyite and spinel are both spinelloid minerals.
Told apart by XRD:
Forsterite
transforms to a denser polymorph at
high P.
Beta-phase
and spinel-Mg2SiO4 are the minerals of the transition
zone.
P/T of
transformation match those of seismic discontinuity.
Density, Vp
and Vs of beta- and spinel-Mg2SiO4 are exactly compatible
with transition zone seismic data.
Also find in
this P/T zone
pyroxene -> garnet (majorite)
Lower
Transition Zone about 60% spinel, 40% garnet structured (Mg, Fe) silicates.
Lower
Mantle
More difficulty
to be sure what is responsible for 670 km discontinuity.
Reasons:
P about 250 kbar ) Difficult
to achieve
T about 1800° C
) by experiment
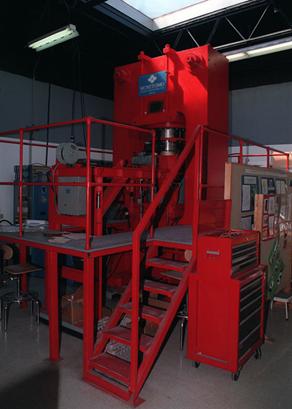
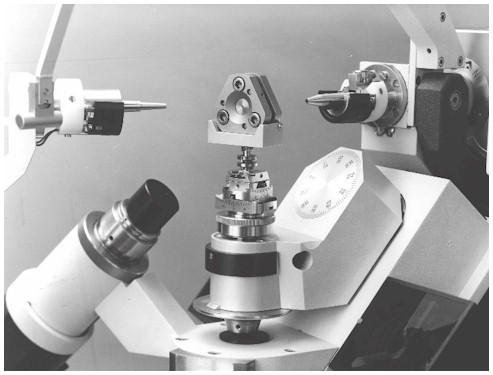
Can be obtained using a Multi Anvil Cell or the
Diamond Anvil Cell and Laser heating (P > 1 Mbar; T > 3000 K).
Both of these techniques are used in research in
UCL-Bbk.
Multi-anvil
cells need a large load frame:
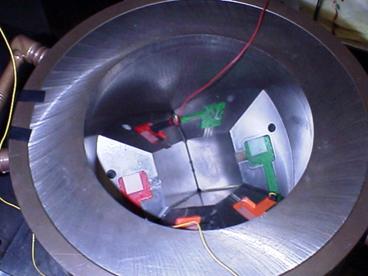
Problem with
MAC difficult to do in situ studies.
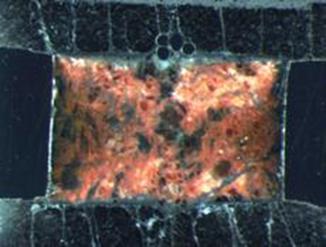
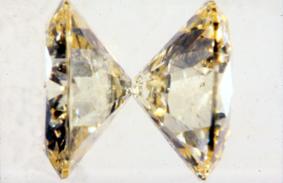
In situ
possible in DAC, but very small sample volume (<10-2 mm3 for
DAC).
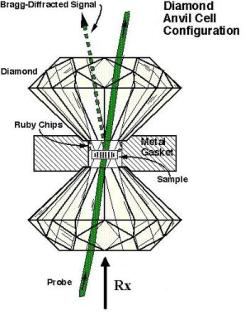
High P
generated by very small area of diamond tip (c.f. stiletto heels).
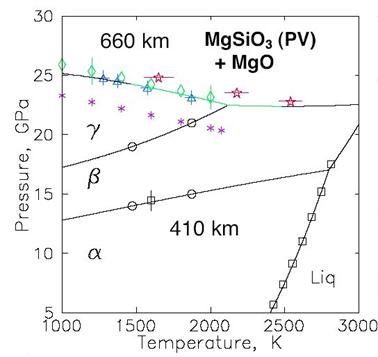
At P/T of
670 km discontinuity have spinel structure polymorph disproportionation to
perovskite structure MgSiO3 + MgO. :
Mg2SiO4 -> MgSiO3
+ MgO
spinel
perovskite periclase
NB: Si
coordination change: Si [IV] in spinel -> Si [VI] in perovskite
Also at ~25
GPa
Garnet -> Perovskite
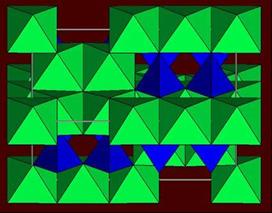
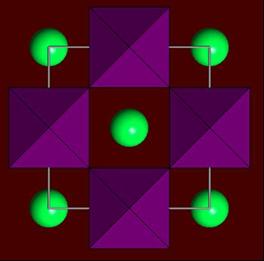
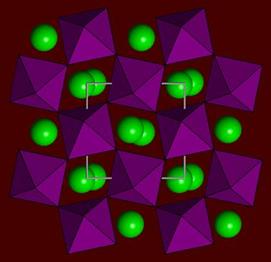
Lower mantle composed of (Mg,Fe)SiO3
perovskite plus (Mg,Fe)O - magnesiowustite, plus minor phases such as CaSiO3-perovskite.
Ca-perovskite is cubic (or almost), Mg-peroskite is
orthorhombic:
Because it is so difficult to make, we do not know Vs,
Vp for MgSiO3 perovskite very well still the basis of active
research.
670 km discontinuity is likely to be an isochemical
phase transformation, but lower mantle could be richer in Fe or Si than
transition zone. Still not sure.
Other phases will occur in mantle because of
subduction, etc, basalt in slab will change:
Have SiO2 phases here in LM subducted slab.
SiO2 phases are complex:
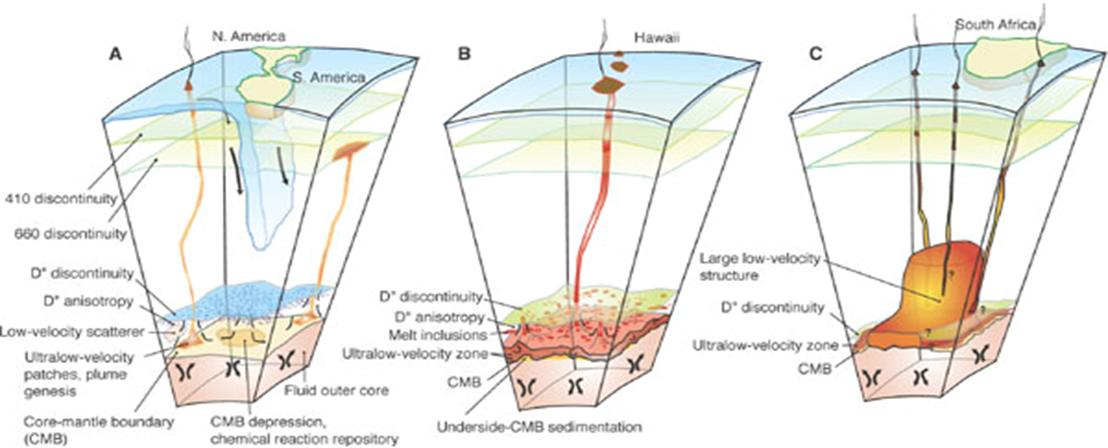
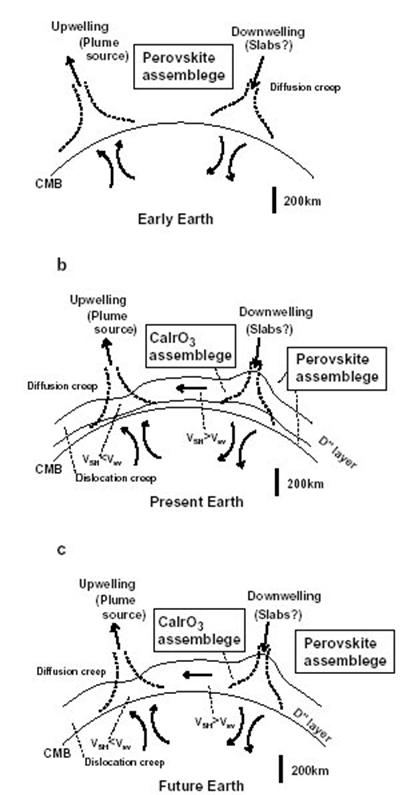
Core mantle boundary D is a complex region
perhaps melting, perhaps reaction zone, perhaps slab grave yard.
Subject of active research with specific seismic ray
paths, e.g.:
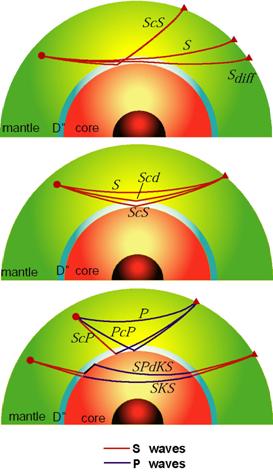
D probable origin of plumes:
![]() ULVZ could be due to
melting of SiO2 rich pods.
ULVZ could be due to
melting of SiO2 rich pods.
![]() Whether there is a
reaction between silicates and oxides of D and core depends on the chemistry
of the core.
Whether there is a
reaction between silicates and oxides of D and core depends on the chemistry
of the core.
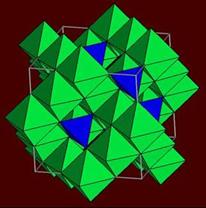
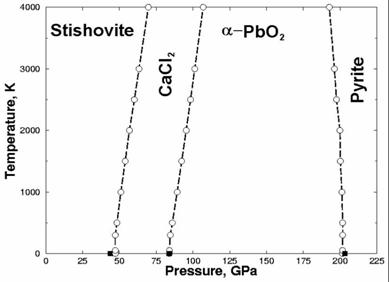
![]() In 2004 a new phase
transitions was found, when perovskite transforms to a post-perovskite phase
(see Iitaka et al, 2004):
In 2004 a new phase
transitions was found, when perovskite transforms to a post-perovskite phase
(see Iitaka et al, 2004):
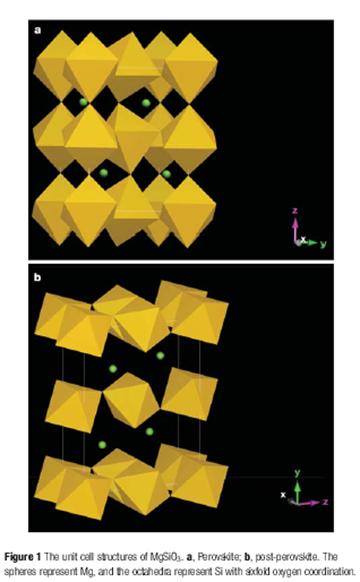
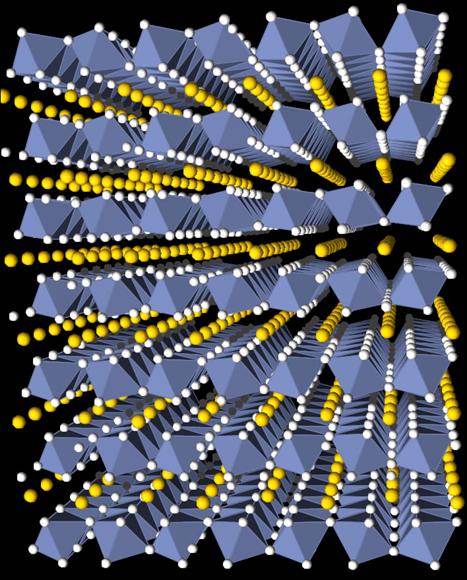
![]() The structure is
iso-structural with CaIrO3 and is characterised by having edge
sharing SiO6 octahedra.
The structure is
iso-structural with CaIrO3 and is characterised by having edge
sharing SiO6 octahedra.
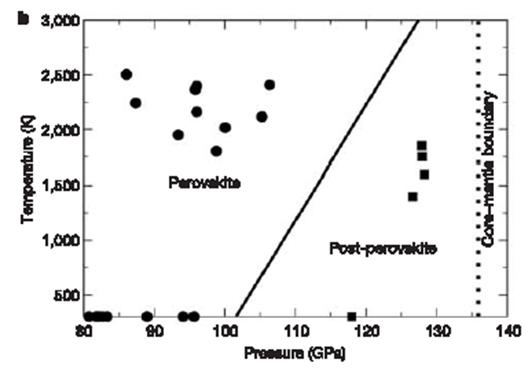
![]() Perovskite will
transform into the new phase at a P which corresponds to the D boundary (see Oganov et al 2004):
Perovskite will
transform into the new phase at a P which corresponds to the D boundary (see Oganov et al 2004):
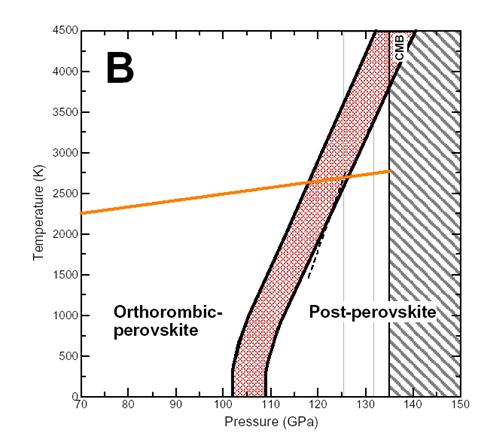
![]() and Tsuchiya et al 2004:
and Tsuchiya et al 2004:
Lower mantle now seen as:
![]() Still the subject of
active research, but thought to explain reflector at 2650km in cold regions,
and no reflections in hot regions:
Still the subject of
active research, but thought to explain reflector at 2650km in cold regions,
and no reflections in hot regions:
![]() D Vp, Vs, Vbulk and
Density for hot and cold geotherms. Perovskite as solid lines. The effect of
post-perovskite shown in dotted colour lines. PREM black dotted:
D Vp, Vs, Vbulk and
Density for hot and cold geotherms. Perovskite as solid lines. The effect of
post-perovskite shown in dotted colour lines. PREM black dotted:
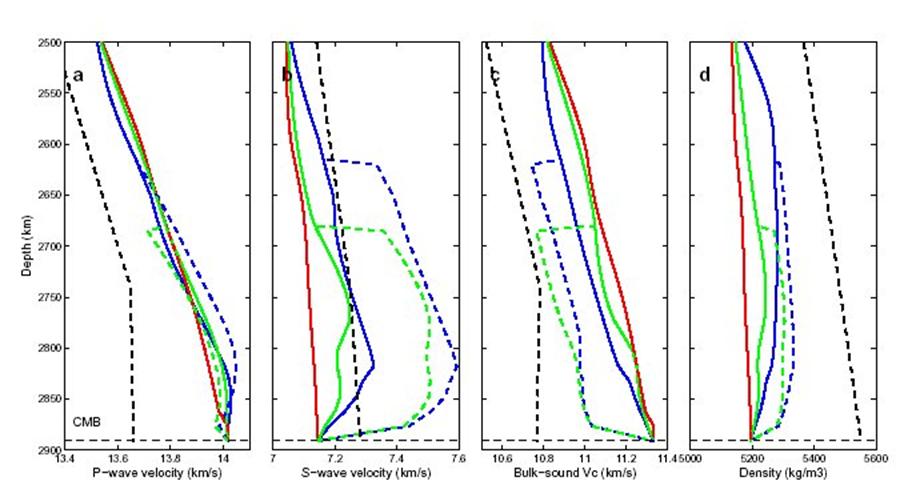
![]() Note Vs and Vbulk
anti-correlated. Vp not greatly affected.
Note Vs and Vbulk
anti-correlated. Vp not greatly affected.
![]() D and
post-perovskite only present in cold regions:
D and
post-perovskite only present in cold regions:
![]() also not in early
earth
.
also not in early
earth
.
· Core
Believed to
be Fe rich on basis of
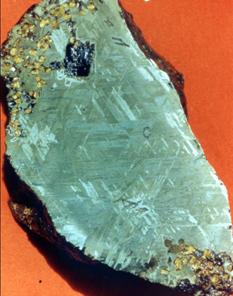
(1) Cosmic abundances.
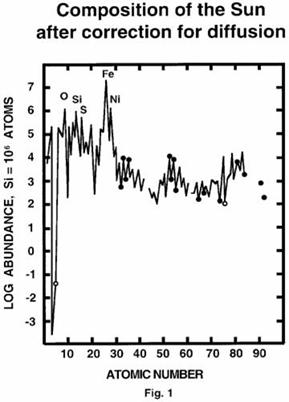
(2) Iron meteorites.
(3) Seismic Characteristics:
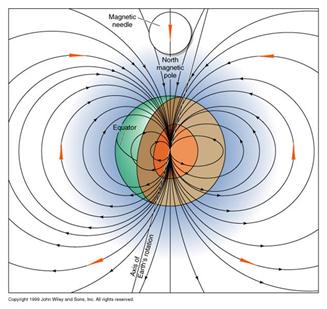
(4) Metallic conductor to give magnetic field.
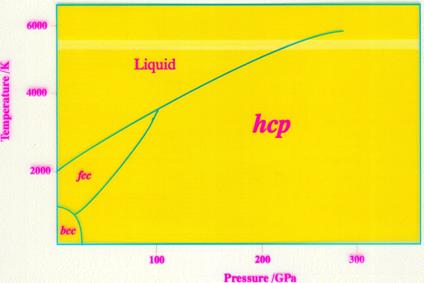
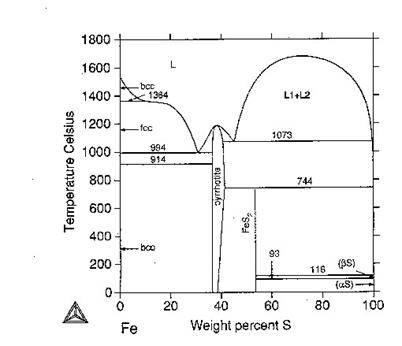
P + T of core very high. P > 1.5 Mbar, T about 5000-6000 K.
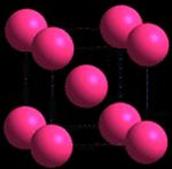
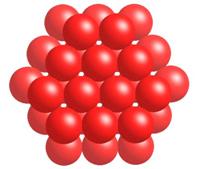
Phase
diagrame of Fe, suggests that Fe in the core is hcp-Fe:
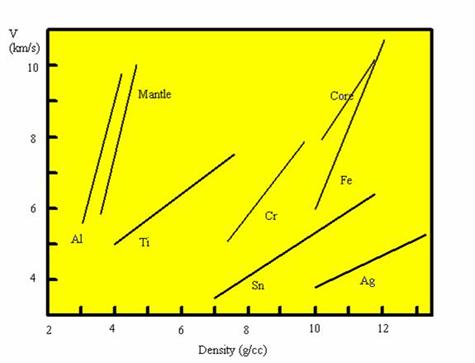
Vp, Vs of Fe
at these pressures not easy to determine.
Can be
obtained from Shock-Wave experiments, inelastic scattering or theory:
Pure Fe
considered too dense for outer core. Must be alloyed with lower density
elements - Si, S, C or O?
S found in
iron meteorites. Fe-S outer core fits density data for 9-12% S by wt.
Is the outer
core - inner core boundary isochemical or is there any compositional change?
Shock data
suggest IC a little less dense than pure Fe.
Could be an
Fe-Ni alloy (if meteorites). In this case the OC/IC boundary is a
chemical discontinuity.
Recently Alfè et al suggest:
OC
: 82 mole% Fe, 10% S, 8% O
IC:
89.5% Fe, 10% S, 0.5% O
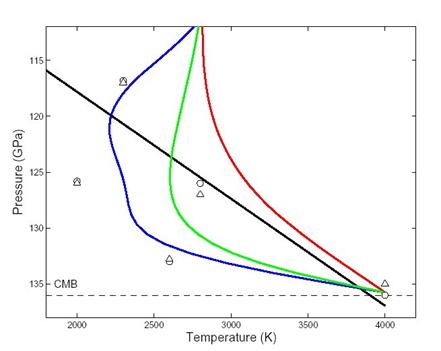
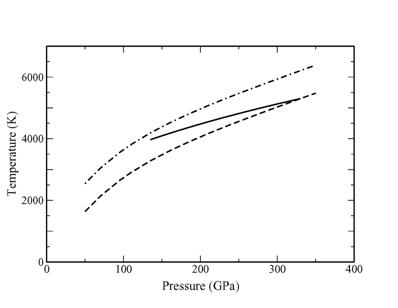
Probable
model is that the IC is crystallising from OC. T of ICB is close to T melt of
Fe:
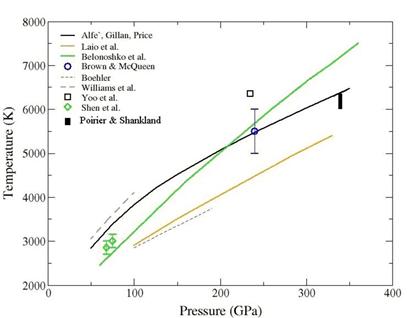
Crystallisation
occurs as core cools below Tm.
Outer core
is enriched in light elements as they are more soluble in liquid than solid Fe:
High P phase
diagram not know in detail. Only low P studies:
Details of
the core not well established and still open to revision (see recent paper by Vočadlo
on Fe in the core).
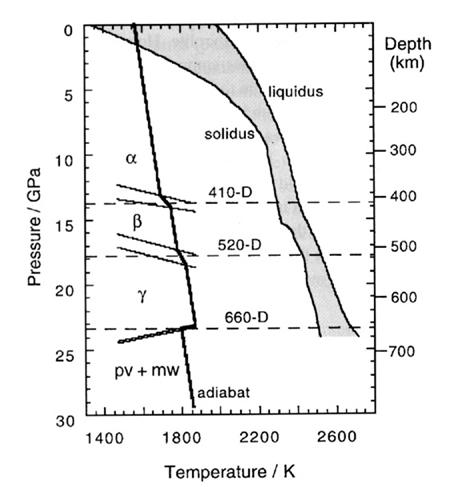
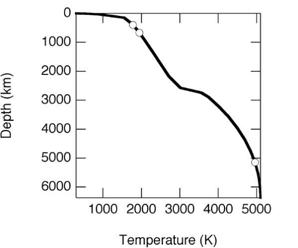
Thermal
structure of the Earth can be obtained from P-T points of discontinuities,
linked to known phase relations:
Will return to
this when we look at Heat in the Earth.
Click here
for more detailed notes of data analysis of deep Earth seismic
waves and here for more on structure.
Click here
for a practical on Seismology &
Earth Structure.